


Yesterday Celgene finalized its acquisition of Juno Therapeutics for $9B, only a few short months after Gilead bought Kite Pharma for $11.9B.
With only a few hundred patients ever treated with their therapies, $20B represents a lot of promise in both their lead products and the space itself. Both biotech firms, along with Novartis, have pioneered the field of chimeric antigen receptor T-cell therapy, or CART, and have built the leading platforms in the space. And while many may reflect on their differences, the reality is they are quite similar: lead programs targeting CD19 in ALL/NHL, robust pipeline/platforms, strong cell manufacturing capabilities, stellar teams, and large cash balances ($700-900M at time of acquisition).
There’s plenty of commentary of these acquisitions elsehere, including why they are good for both the acquiree and the acquired, and what they mean for advancing CART to more patients and the biotech industry as a whole. Hopefully these deals will catalyze a renewed enthusiasm for M&A that was lacking in most of 2017.
But instead of adding further to that dialogue, I’d like to share a short post on the investor returns from these two fantastic outcomes.
Both of these deals led to massive returns to private and public investors alike. They both are in the top 2% of venture capital outcomes. Early investors (like David Bonderman of TPG and Alta Partners in Kite Pharma, and ARCH in Juno) made huge multiples and enormous absolute returns.
To get into the details, here’s two charts that capture the share price changes over time, derived from their SEC findings, as best as I could dissect (so apologies now if I’ve got some of these wrong).
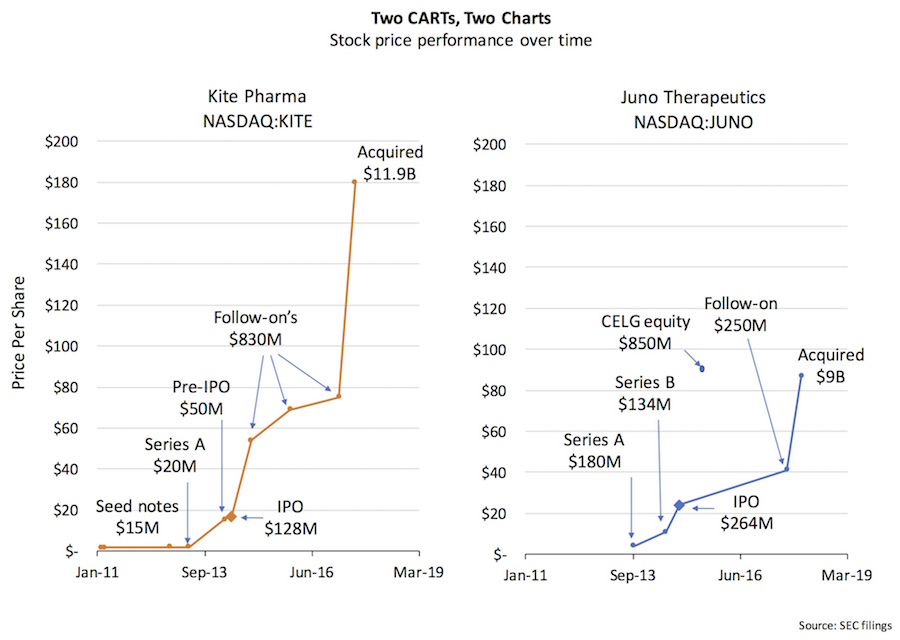
Kite Pharma ($KITE) raised convertible seed rounds in 2011, which converted at a 15% discount in the spring of 2013 into their Series A – which was (inclusive of the seed notes) a total of $35M at $1.85/share. A pre-IPO mezz round of $50M was raised as a convertible into the IPO price, coming in at a 10% discount to the $17.00/share IPO in 2014 (i.e., a 8.3x into the mezz round, and a 9.2x into the IPO). So Kite technically raised $85M as a private company (though mezz was only a few months pre-IPO). After their $128M IPO financing in 2014, Kite raised $830M in a series of follow-on public financings at steady price increases, and was acquired by Gilead ($GILD) in August for $180/share or $11B in value. In total, Kite raised $1.0B in equity capital over its lifetime.
Juno Therapeutics ($JUNO) raised a large $180M Series A in 2013 at $4.00/share, following in 2014 by a $130M Series B round at $10.92/share (or a 2.7x step-up). Over two years, Juno raised $314M as a private company. In Dec 2014, Juno went public, raising $264M, at $24/share, or a 6x from the Series A. Juno then struck a deal with Celgene ($CELG), where the latter purchased 9% of the company for $93/share, raising $850M in equity financing. Juno’s public follow-on financing only 5 months ago raised a additional $250M. Celgene’s 2018 acquisition of Juno valued the business ~$11B, or $9B net of the cash on the balance sheet and the equity it already owned. In total, inclusive of the 2015 strategic investment from Celgene, Juno raised $1.7B in equity capital over its lifetime.
Here’s a table that captures the relative return multiples.
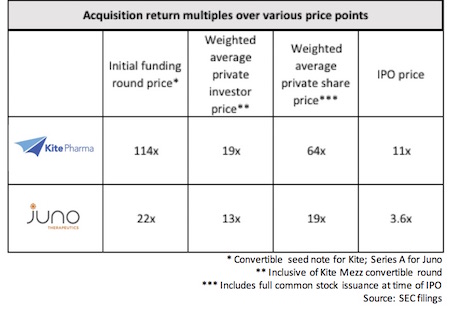
The Kite seed round, which priced at $1.58, delivered a 114x return into the acquisition. By my math, David Bonderman’s investment of $4M in the seed and Series A returned over $420M, a 108x return. That’s real money, and a fantastic return – and a material event even for a TPG founder. Alta Partners (assuming they held to the acquisition) would have converted their $15M investment in the seed/A/mezz into more than $500M.
Although the multiples are different, Juno also delivered massive returns. Arch Ventures, as a Juno founder, got common stock for its role in pulling the story together. From what I can glean from the SEC filings, because of that founding stock position (roughly 10% of the firms total equity position in Juno), the weighted average price for Arch was $3.90/share – delivering a very solid 22x return on $45M invested. That’s a $1B win for Arch. Wow. Congrats to Bob Nelsen.
Couple final reflections.
While both deals are huge wins, the comparative math on Kite’s multiples suggests it was a more “capital efficient” story. They raised less in the Series A, drove a big step-up into the mezz round, and then raised the vast majority of their equity capital in the public markets at very robust prices.
At the time of Juno’s Series A of $180M, many pundits wondered how Kite was going to compete with it: Juno had a war chest that was ~5x bigger than Kite’s at the end of 2013. Kite was widely regarded by the media as “second fiddle” to Juno’s lead position, all the way through their early days as public companies (e.g., Juno had a 2x valuation premium over Kite for some time in 2015). In hindsight, it’s clear that Kite did just fine – getting to market with Yescarta more than 12-18 months faster than Juno’s CD19 program, and securing a nearly $12B acquisition from Gilead. Importantly, Kite’s more capital efficient approach didn’t imply not powering up the story – they just did it with lower cost-of-capital equity from the public markets. In a world where the public markets are open and accommodating, capital efficiency is often ignored, but scaling with disciplined equity capital raises preserves attractive strategic optionality when markets get tougher or things take longer.
It’s also clear that public investors did quite well in these deals – unlike some outcomes, both private and public investors can only be happy with these deals. Kite’s IPO investors made over a whopping 10x, and Juno’s nearly a 3.6x (in 3 years, so still a very strong public market return). Even the follow-on financing participants made handsome returns: both Kite’s and Juno’s follow-on financings about 4-6 months prior to acquisition delivered a 2x return in a short period. What’s clear is that participating at any point only these price curves was a positive for investors. Obviously that doesn’t always happen, but great to see when it does.
A final takeaway is that there is “no one size fits all” for how to build business models that can work in biotech these days, even to get to similar product and patient outcomes. While Kite and Juno have remarkably similar products, similar platforms, and similar overall acquisition valuations, the stories were built quite differently when it comes to financing their growth.