


Biotech punches way above its weight-class, and that’s never been more apparent than in this pandemic and the race for a COVID vaccine.
For those of us in biopharma, it feels like it’s a large and dynamic sector populated by an endless number of large and small companies, scientists, business types, pundits, lawyers, accountants, and more. It seems really big at times. And the dozens of daily news stories make it seem even more so: quarterly earnings updates, clinical data releases, FDA decisions, people on chutes and ladders, etc.
But, in reality, the biopharma sector is really quite small relative to rest of the market.
Context is everything, and stepping back from the trees to see the forest is always a healthy thing to do.
Here’s a stat that sums up the relative scale of biopharma: The top 3 Tech companies have a greater combined market capitalization than all of the biotech and pharma universe combined (>$3.5T), including near ~1K publicly-traded companies.
That’s right – just three companies, Microsoft, Apple, and Amazon – are collectively bigger in market cap than the combined valuations of J&J, Pfizer and all of the other biopharma companies down to the most recent IPO and micro-cap stock. And there are dozens of other huge tech players, from Alphabet to Facebook to Intel and others, behind these three. Our sector is simply dwarfed by their size.
Another scale comparison for perspective is around their balance sheets: we think the cash positions in Big BioPharma are huge when we talk about Gilead’s $20B+ or AbbVie’s $30B+, but the Google, Apple, and Microsoft above have a combined cash positions that could fund all of the R&D in the entire biopharma industry for almost two full years, north of ~$350B. That’s a staggering amount of cash.
Why is any of this context important? Why is understanding the scale of biopharma relevant?
It’s important in order to appreciate that even minor changes in the sector’s attractiveness relative to other sectors in the economy can dramatically impact the robustness of the equity markets in biopharma, especially for the emerging players. Further, the 600+ players in the pre-commercial small and mid-cap biopharma universe, the space we often call “biotech”, are almost exclusively reliant on fund flows from the broader equity capital markets for their survival.
Here are a few observations about how biopharma, and the Life Sciences (LS) sector more generally, fits into the broader financial world, courtesy of data from Cowen & Company.
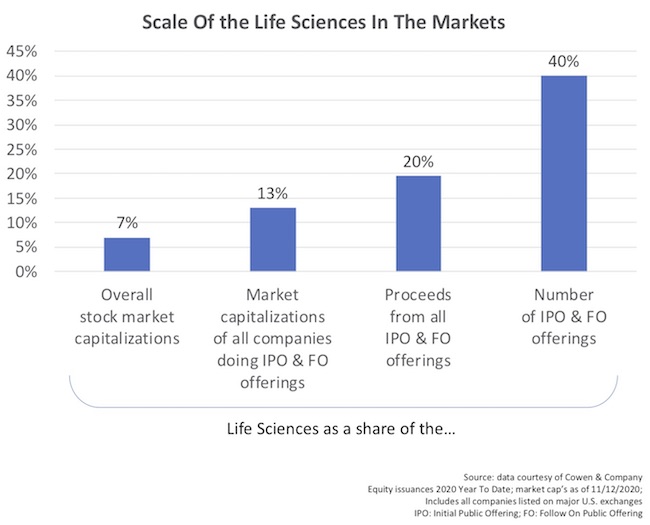
Biopharma is relatively small share of the overall US equity capital markets. The stock exchanges in the US represent close to $49 trillion in collective market capitalization. All of the biopharma represents 7% of the market, which includes the largest players in our industry. Biotech, as a subset and inclusive of the “Big Biotech” firms, reflects just 2.7%.
Biopharma goes way above its weight-class in the new equity issuance market. Because the life sciences are largely a cash-raising, loss-making, equity-burning sector, it is a much larger percentage of the new equity issuance market. For all of the IPOs and Follow On public offerings on the US stock exchanges, life sciences represent 13% of the aggregate market valuations of these issuing companies, 20% of all the proceeds from these offerings, and 40% of the number of offerings.
Biotech, and life sciences in general, have been growing in its share of the equity issuance markets. In recent years, biotech has been booming. As described earlier this year, we’ve witnessed a tsunami of funding flows into the sector. While other sectors have also experienced the exuberance of market appreciation, biotech’s buoyancy has exceeded most others. The IPO markets in particular have evolved in a much more favorable way for biopharma in recent years, especially since the JOBS Act in 2012.
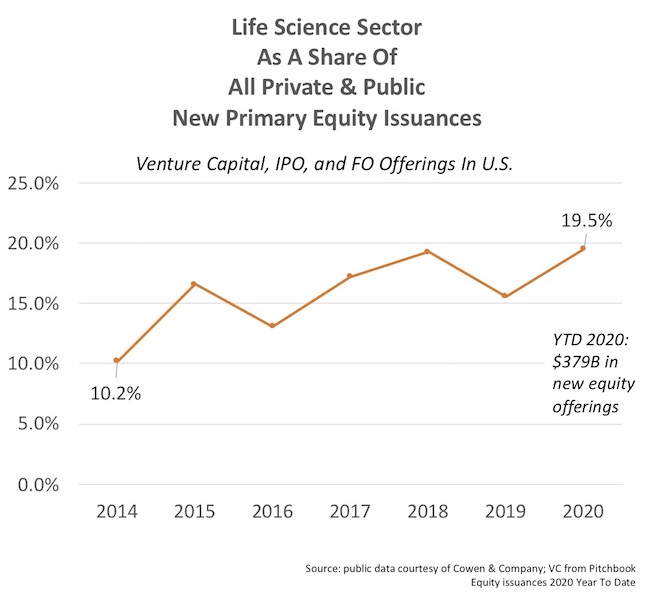
Funding flows into biopharma companies from Life Science venture capital, IPOs, and FOPOs have therefore all edged up in terms of “market share” vs other sectors in each category. Larger rounds than in the past, and more of them, have driven this increased share. As the chart below shows, in aggregate, the LS sector has moved from 10% to nearly 20% of all of these aggregate funding flows.
The increasing role of biopharma in the new issuance market has increased the numbers of publicly-traded LS companies. As I wrote in a 2011 blog post, “Our Shrinking Biopharma Ecosystem”, the number of publicly-traded biotechs in the US had dropped by over 25% from 2005 through 2011. This changed dramatically as the IPO markets opened up from 2012 to 2016, increasing by 50%, as described here in “The Incredible Expanding Universe of Biotech Stocks”. And it has only gotten larger in the past few years.
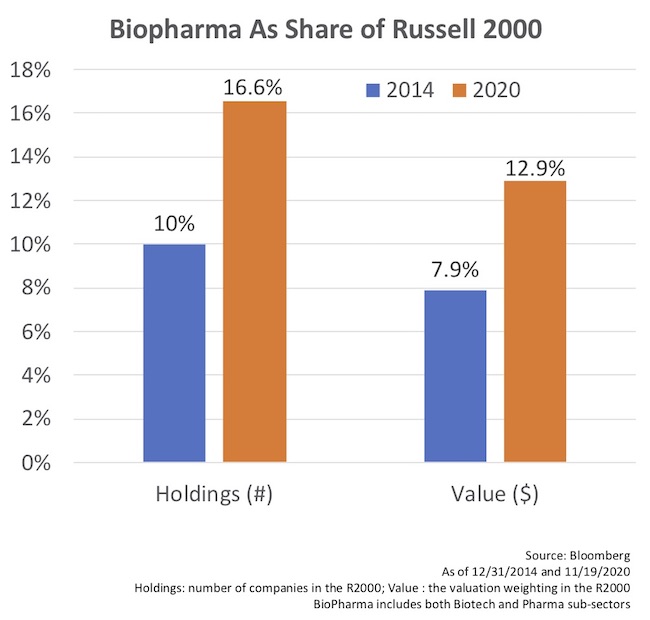
As evidence of this, biopharma has been increasing in both its share of the companies and the value-weighting in the Russell 2000 index. The Russell 2000 is the most well known index for small and mid-cap companies in the US stock market. Since 2014, both the number and valuation of the biopharma sector in the index have gone up over 60%. Biopharma is now the largest sub-sector in the Russell 2000.
While all these data points are intuitive, and likely not surprising, to those familiar with the capital markets, there are a few implications.
Small numbers, outsized impacts. Biotech is very sensitive to small changes in macro sector allocations. Whether the risk-on or risk-off sentiment is prevalent, or if broader sector rotations by asset managers are in place (including growth vs value investing), the reality is very small aggregate changes in how investors allocate the nearly $50 Trillion in equity value in the US markets can have big impacts on biotech. As an example, if asset managers moved just 0.1% towards the life sciences, that would be $50B in value – more than all of the new public equity issuances in biopharma in 2020, a boom year for offerings. Changes to how we reward R&D and innovation in society can easily impact sentiment and these macro allocations.
Bigger food attracts bigger fish. As Biotech has gotten bigger within the new issuance market, it’s become meaningful for larger equity managers. These big fish can’t waste their time eating small bait. In the past, it’s been hard for the biggest asset managers to participate actively in biotech IPOs or FOPOs if they are only getting a small piece of a $50-60M offering. Today, the median offerings are much larger (4-fold higher), which has created “space” for bigger players to participate. This is a feed-forward phenomenon that has provided positive tailwinds in demand for the sector’s new issuance markets, and it’s evolution was described here.
Getting into the indices matters. As more biotech companies enter the Russell 2000, that means more market ETFs will include them, and more managers will need to allocate to them – driving further demand for biotech stocks. With more asset managers who benchmark, and get paid off of performance versus these indices, this brings incremental and generalist buyers into these stocks. It also raises the awareness of young biotechs that get included in the index. This also creates more underlying demand for biotech equity in the markets.