The equity markets have softened tremendously in recent weeks and the NASDAQ Biotech Index has swooned to levels last held in late 2014, in line with other equity indices like the S&P500. Triggered by significant and negative macro forces, this downdraft and volatility has led to a “risk-off” bias that has pulled capital out of equities and hurt biotech in particular, creating anxiety on the part of the sector’s private and public investors.
Against this backdrop, it’s worth highlighting an underappreciated element of today’s environment: many of the newly minted biotech IPOs since 2013 are incredibly well capitalized, leaving them, if they are prudent with their cash, with significant resources to advance their pipelines and focus on long-term value creation.
Cash hordes.
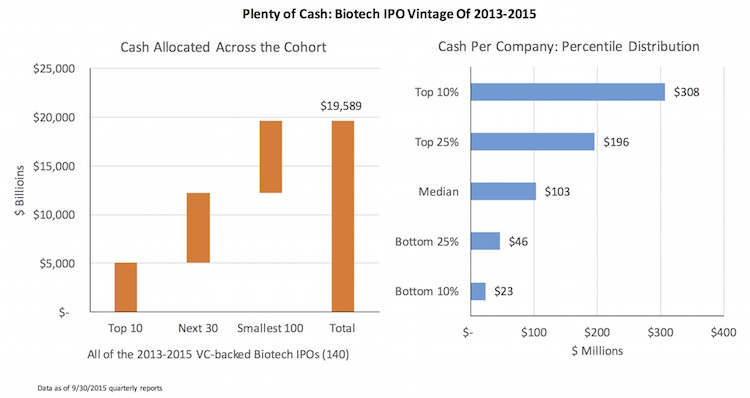
Examining the balance sheets of the VC-backed biotech IPOs that went public since early 2013, there’s nearly $20B in cash and short term equivalents. The chart below captures the distribution of these cash figures – either in aggregate buckets, or by looking at the cash per company at different percentiles in the distribution.
The top 10 largest balance sheets (7% of the companies) have approximately $5B between them, or 25% of the overall cohort’s cash horde. This includes Juno’s $1.1B and Bluebird’s $700M, with Radius, Ultragenyx, and Aduro all coming in around $500M. Top decile companies have north of $300M in cash, and the median – which is amazing to me – has over $100M. Seventy of these newly minted IPOs still have over $100M in cash.
These cash positions reflect the wonderful benefits of accessing lower cost of capital financing, and the power of a more accommodating capital market to power up a great new wave of public biotechs. Some of these are now well equipped to become this generation’s Regeneron and Alexion.
Long runways.
For cash-burning R&D-stage companies, the obvious benefit to cash hordes of this size is a much longer runway before the next financing is needed. To make a very rough calculation of how long this cash horde can support this crop of biotechs, we’ve estimated a monthly burn rate by looking at trailing twelve month operating expenses (R&D, SG&A, etc). I know operating costs change over time (and go up as programs enter the clinic), but it’s a reasonable approximation for now.
In aggregate, this group burnt $7.7B in expenses over the twelve months through 9/30/2015. So the current $19.6B in cash provides the group with a full 2.5 years of cash runway. The median cash runway in this cohort is 29 months, very similar to the weighted average above. Further, about a quarter of the companies have estimated cash runways north of 46 months; said another way, at least 35 companies in this group have four or more years of cash runway based on current monthly burn rates.
Although I don’t have historical bechmarks at my finger tips, these cash and runway statistics strike me as unusually large for young cash-burning biotech companies, and bode very well for weathering the storm.
Poor valuations.
With stock prices falling, valuations relative to cash have collapsed to near all-time lows for this group. A commonly used metric for relative valuation is the market capitalization to cash ratio.
First let’s take a glance at historic cash multiples: small cap, unprofitable biotechs have typically hovered in aggregate around 5x cash multiples. The 10-year weighted average is 4.8x in this subset. These ratios are in line with work I published a decade ago in Nature Review Drug Discovery, with a longer term historic average between 4-5x. The ratio fell to below 2.5x at the bottom of 2003 in the “nuclear winter” of biotech (see chart here). With the recent pressure in the markets, Mark Schoenebaum and Evercore published some work showing that these small cap unprofitable biotechs had dipped just below 4x (where cash represents 25% of their valuation).
Importantly, these metrics incorporate all the small cap biotech companies, including the ones that have seasoned extensively in the markets (i.e., “seasoned” means “old”), and have more float and an easier follow-on or secondary financing ability. Newly minted IPOs generally sell 30%+ of their company in the offering, so by definition at offer they generally have ratios around 3x; after-market stock appreciation(the numerator) and the burning of cash (the denominator) have historically moved their cash multiple ratios upwards over time into the 4-5x range relatively quickly after their IPOs (within 12-18 months).
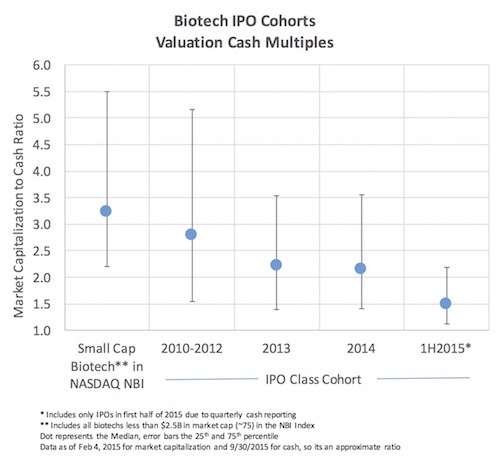
With that context, by my calculation, this three-year IPO vintage is trading at historically low cash multiples. In aggregate, the valuation-weighted average cash multiple remains 3.0x for this group, in comparison to 4.3x for 2010-2012 IPOs, and 4.0x for older micro caps in the NASDAQ NBI – based on this week’s stock prices and 9/30 cash numbers (a disconnect, I know, but a good approximation). However, these weighted averages are skewed by companies with larger relative enterprise values so its more interesting to look into the distribution itself where the medians and quartiles are striking.
The median cash multiple for companies that IPO’d in 2013 and 2014 is only 2.2x (meaning 45% of their market cap is cash), and for the companies that got out in the first half of 2015, its only 1.5x (67% of their market cap is cash). I’ve not done it for more recent IPOs quarterly reporting requirements, but its very likely that those cash multiples aren’t pretty.
So what to make of all this? A few takeaways:
First, we’ve got lots of “cash rich, valuation poor” young biotech companies. They can and should focus on delivering compelling product data with their long burn rate runways, which if strong enough will create value even in volatile markets.
Second, as a VC focused on building companies and funding innovation, I’d argue that prudent companies and their Boards should focus on cash management and burn rate planning. Being thoughtful about where the levers of value creation are relative to the uses of capital is important (don’t spend excess amounts of capital on efforts unlikely to create commensurate value during this financing cycle). My message here is simple: make sure you manage the horde of capital you raised in 2013-2015 so that you’ve got the runway to get through the critical value inflections. Look to leverage new less-dilutive Pharma partnerships to help finance the advancement of your story. Understand your actual cost of capital and try to avoid another round of financing in markets like this. Finding yourself with little cash but a bevy of really cool assets leaves you in a troubling and incredibly expensive situation (from an early investor point of view) – unless you find an excited buyer, this high cost of capital will wash out the current/existing shareholders in favor of new ones, destroying long term returns. We’ve seen it happen in prior cycles – and these cash cushions could help prevent it from happening across the board today. With the recent healthy IPOs of of Editas and Beigene, both of which now have north of $240M in cash and short term equivalents (and cash multiples near 3x), maybe there’s a glimmer of hope that the recent spike in the cost of capital will subside – but a more prudent perspective wouldn’t set expectations around it.
Lastly, although I’m not a public market trader, if I were I’d be watching the cash multiples in this cohort of young public biotech companies to find ways of investing in compelling product innovation at very attractive enterprise values. A number of more recent IPOs have enterprise values near zero and yet very interesting early clinical stage programs likely to benefit patients and deliver value.
With the collective balance sheet strength of many young biotechs today, and the positive fundamentals of the industry still well intact (here), there’s still a strong rationale for long term optimism in biotech.


