Startup ecosystems supported by venture capital are defined by dynamism, with the creation, growth, exiting, or failure of new innovative companies conspiring to keep these entrepreneurial landscapes in constant change. Investor returns and sentiment are dramatically impacted by how these events shape and evolve those ecosystems.
Two worlds exist in venture capital, at least from my vantage point: Tech venture capital, largely dominated by the 800-lbs gorilla of software investing, and life science (LS) venture capital, predominantly focused on therapeutic biotech. These worlds largely live in different universes, and attempts to create a unified view default to represent the former given its scale.
Back in 2014, amidst the Tech VC startup explosion, this blog examined some of the critical differences in these two venture worlds, with a focus on the pace of startup formation and how it was balanced against (or not) the “exit” demand for these companies. The “flux” through these ecosystems, a sort of a life-and-death closed system model of VC sectors, was described as a tool to appreciate where sectors were heading. The relative abundance, or scarcity, of investors in these two sectors was a big driver for these ecosystem-level forces (here).
At that time, the Tech VC world was creating and funding companies at a far faster pace than the prevailing exit demand could match, which implied that the ballooning number of startups (and active investors) would eventually derail the sector if exits didn’t increase. That appears to have played out over the past couple years since the post. These days not a week goes by that tech pundits aren’t opining about the unicorn crisis, the softening of the tech startup market, and some version of the coming tech-apocalypse (here, here). Benchmark’s Bill Gurley’s very thoughtful recent post outlined the real dangers of the unicorn phenomenon, and the potential impact on different stakeholders. Back in 2014, he nailed it in a WSJ interview: “Excessive amounts of capital lead to a lower average fitness.”
On the biotech side, in mid-2014, we were in the midst of a booming exit environment, in particular for IPOs, and valuations were steadily increasing for private companies and new offerings; however, the sector remained reasonably constrained with regard to venture creation and overall funding. Today, although biotech has had a great multi-year run, there’s plenty of anxiety about where we go from here as the NASDAQ Biotech Index is off ~25% for the year (here, here), and more than 35% off from “Peak Biotech” of July 2015. Top line VC funding levels are also off by 20%.
In light of the evolving landscape in these two sectors, it’s worth revisiting the macro ecosystem dynamics, and to explore whether they’ve changed in the past couple years: the supply of new startups, the funding of emerging companies, and the exit demand supporting eventual liquidity.
Supply of new startups
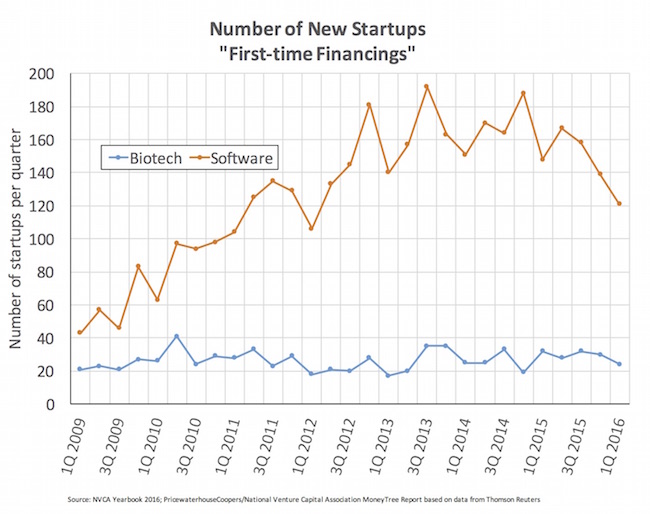
The venture creation disparity between the two sectors remains significant, as depicted in the chart below: just in terms of the numbers of companies, software startup creation remains up 3x+ since 2009-2010, and biotech is flat over the same period.
Biotech’s venture creation machinery continues to defy the downstream exit demand in the system, holding steady where it has been since the bottom of 2009, demonstrating remarkable inelasticity of startup supply formation. According to data from Thomson Reuters, as tracked by the PwC/NVCA Moneytree report, in the first quarter of 2016 the sector launched 24 new biotechs with their first venture financings; in 2Q of 2009, the sector created 23. I’ve explored many of the rate limiting aspects of biotech venture creation, and the changes in the model over the past 10 years (here, here), so won’t get into the details with this blog; in short, biotech venture creation remains a highly constrained, rate-limiting process.
In contrast, the “Cambrian explosion” and tech startup “glut” that was emerging in 2014 continued apace for another year into 2015, only cooling off in the last two quarters. Even with the 25% pullback in early 2016, rates of software startup creation are still 2.5x higher than they were 5-6 years ago.
Fundamentally, tech startup creation has a far lower barrier to entry than biotech. A huge pool of potential computer-savvy entrepreneurs enters the workforce every year; coding new software doesn’t require decades of drug R&D experience; and access to seed-stage capital from angels and others is both abundant and straightforward (thanks in part to AngelList). This mix of entrepreneurs, skills, and seed capital has led to an explosion in the number of companies, which has been reinforced by the next key element: burgeoning amounts of growth capital to build/scale those companies.
Funding into emerging companies
Once a startup is up and running, access to capital to grow the business is critical in any sector. This “build” stage is both exciting and fraught with challenge: over-capitalize too early and a startup may fail from the well-known risks of premature scaling (a.k.a. being out over your skis on valuation relative to your story). High burn rates can set companies up for a crash course in down-rounds. But the opposite is also bad: under-capitalize a startup and starvation will prevent its growth. Minor hiccups can then throw cash planning out the window. This is the Goldilocks moment of equity capital efficiency: deploying equity capital in a smart way to create value over time.
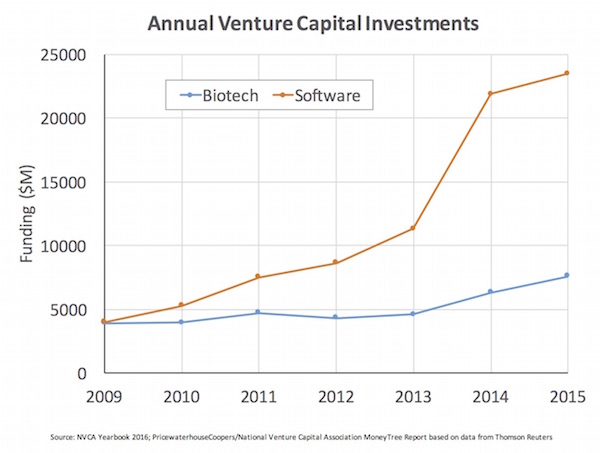
Since my 2014 observations of the funding dynamic in these ecosystems, both tech and biotech have changed in some ways, but not in others. The chart below captures the high-level venture funding trends in software and biotech.
Tech’s tsunami of new startups was met with prodigious amounts of growth financing from both VCs and public crossover investors; this is the phenomenon Bill Gurley’s recent post described. Focusing on software investing alone, VC funding levels are up nearly 5x since 2009-2010, peaking just under $25B in 2015 (vs $5B in 2010). It’s interesting to note that biotech and software started out in 2009 with similar levels of funding.
Further, this wave of funding has supported a 2-3x increase in the total number of private software companies securing financings each year – a vast increase in the pool of private companies. More capital flowing into more startups at higher valuations (at least for a while) makes for a hyper-competitive environment where it’s often hard to build sustainable companies: lower than average fitness is endemic, or so many tech practitioners believe.
Biotech’s aggregate funding has also moved upward since 2014, but has responded to the attractive exit markets in a more muted way, with annual financing levels up “only” ~75% since 2009-2010.
However, in contrast to tech, the number of biotech companies getting financed hasn’t changed at all: roughly 500 private biotech firms access VC funding each year, and this was true in both 2009-2010 and 2014-2015. Like the sector’s flat startup pace, the overall numbers of VC-backed biotechs have been remarkably flat over the past five years. One variable that will be interesting to watch is the funding of first financings through the rest of 2016; although the number of new startups is flat, the funding levels (i.e. average size of the initial funding) went up significantly in 2015.
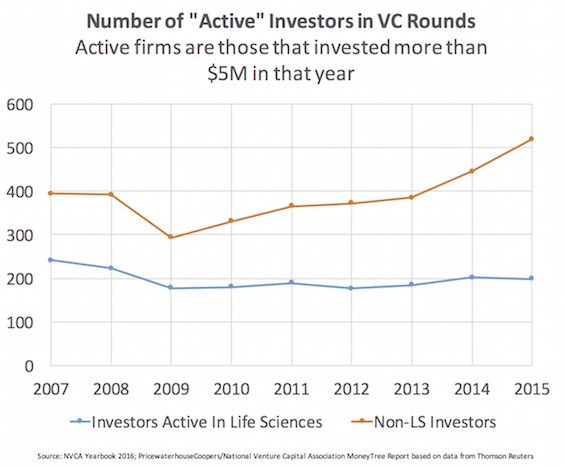
A big driver behind these funding trends is the supply of investors active in each sector. The trends in 2014 on investor numbers and their impact on the startup ecosystems have largely continued (here). In fact, fundraising by VC firms has been off the charts since 2014: nearly $70B has flooded the coffers of VC firms across the industry over the past nine quarters, with 1Q 2016 breaking all records since the dot-com bubble (here). The vast, vast majority of this fundraising is for Tech VC, and supports their expanding numbers. Using the NVCA’s nomenclature of an “active” investor being one that deploys at least $5M into VC-backed rounds in any given year, the chart below captures the trend in both LS and non-LS investor levels.
The number of active (non-LS) Tech investors is now 25% above their pre-2008 financial crisis numbers, and yet LS active investor counts still remain 15% below those pre-crisis levels. This dichotomy reflects a major element of the sectors’ dynamics over the past few years.
For biotech in particular, I’d further argue that the mix of investors underneath the relatively flat line has changed a lot: in the past few years as crossover investors came into the “active” category, many old-guard life science VCs were disappearing – for the net-net effect of appearing flat and stable. So the number of dedicated venture stage investors in life science has probably shrunk even more.
In short, relative funding and investor scarcity is almost always a good thing for a sector’s long run returns. While famine is clearly not optimal, periods of feasting are typically regretted.
Exit demand out of the VC ecosystem
As most readers will know, the overall biotech sector has experienced a multi-year bull run, and the venture component of the sector is no exception: more IPOs, more M&As than any other period in the history of the industry. For more historic context, check out an earlier post on the uniqueness of the recent period (here).
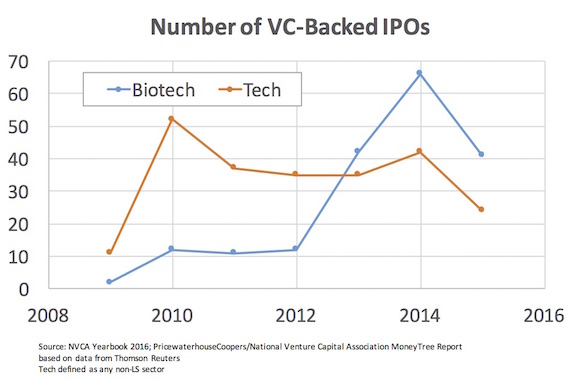
In contrast, tech has seen the IPO window remain very tight; there are plenty of unicorns waiting to storm through the window should it open. The chart below captures the last few years of IPOs in tech (all non-LS categories) and biotech. It’s worth remembering that biotech represents (and has for a decade) only 10-20% of overall venture funding – and yet it’s producing more IPOs than the other 80-90% over the past three years.
It’s clear from the chart that while Tech IPO markets bounced back in 2010 quickly, they largely stalled out in volume (not value, with offerings like Facebook) and have recently shrunk by 50%. This is tough when weighed against the multi-year explosion in the number of startups.
Biotech IPOs were entirely shut off in 2008-2009, but have reached significant record-breaking heights in 2013-2015. In mid-2000s (pre-crisis), 15-20 biotech IPOs per year was the annual pace. In 2016, despite the market’s volatility, we’re pacing for north of that with ten or so already as of the first week of May.
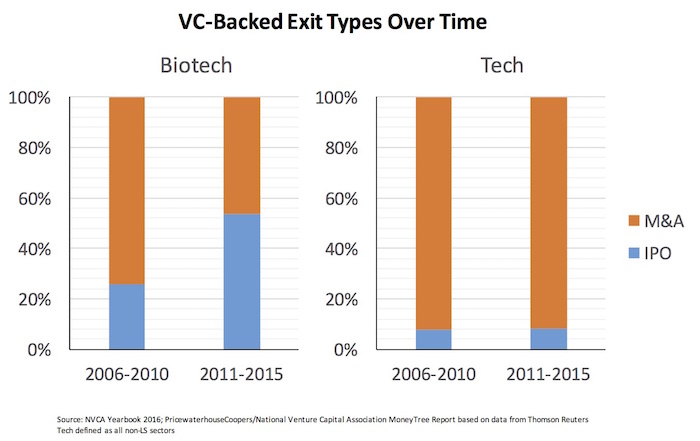
But IPOs aren’t the only way of exiting the venture ecosystem successfully: the other path is via acquisitions from larger companies in search of new product and pipeline. M&A has been strong in both sectors, and up significantly from 2009. Here’s a chart on the relative mix of exit type between the sectors.
The mix has definitely changed in biotech over the past decade, due to the increase in IPOs in 2013-2015, rather than a reduction in M&A. In fact, 2015 was likely one of the best M&A years on record for VC-backed deal values, according to HBM Partners (here).
In contrast, the tech exit mix has been relatively constant, dominated by M&A for 11 out of 12 exits across the decade. Most of this tech M&A, though, is for small deals or “acqui-hires”: relatively modest acquisitions of founder-led startups with great teams. The average software M&A value in the past five years was $56M. For comparison, the average biotech M&A was more than 2x larger, at $126M – where most often it’s about buying pipeline (vs teams).
Robust demand for the equity of startups – either by the public markets or by larger companies – is critical to the health of venture ecosystems.
Parting thoughts
Bubbles often form in the illiquid and exciting world of venture capital, and not unlike many asset classes, it typically follows a conventional investment cycle: an initial scarcity of capital channels to the best startups in a sector, healthy and attractive exits occur, lots of capital pours into the space chasing those returns, prices inflate and more companies get created, hypercompetitive markets depress returns, capital flees those areas, and the cycle goes on.
In a perfect equilibrium, capital would match opportunities and investors would achieve their expected and attractive rate of return commensurate to their risk-taking. But that’s not how it works in practice. Instead, the animal spirits of the market typically cycle between overshooting and undershooting the optimal capital allocation – leading to the well appreciated periods of expansion and contraction. Great returns are often made by being countercyclical to this, as captured by Buffett’s famous line about fear and greed (here). It happens in all asset classes, the sectors within them, and domains within those sectors. Certain areas get hot, and capital seeks them out. The hope is that over time these cycles support an “up and to the right” value creation curve.
Biotech is not immune to these cycles, of course. Over the past few years we’ve seen certain areas, like immuno-oncology, gene therapy, and CARTs, get super-hot, and I’m sure bubblicious elements have been a factor in their ascent beyond their important clinical validation and potential. Valuation inflation happens in every cycle, and we definitely saw that in 2014-2015 in particular. As I’ve noted before, a richly-valued biotech either grows into its valuation through pipeline success, or it gets its value reset. Biotech’s public markets have cooled off considerably since peaking in July 2015, at least at a macro sector level. I’m hopeful that the broader investor community will see this recent softening as a re-entry point to tap into the long-term trend in biotech value creation, supported by the seemingly relentless unmet demand for innovation in healthcare.
But stepping back from the current market sentiment, it’s interesting to reflect on the data above and what it says about the healthy or unhealthy levels of “flux” through a venture ecosystem.
Based on the funding flows, exit dynamics, and the numbers of companies, venture-backed biotech looks remarkably robust and healthy as a sector: over the past five years, as a venture ecosystem it has been in relative “steady-state” balance. Since the number of VC-backed private biotechs getting funded each year has largely been constant, it implies that the pace of startup formation must be matched by departures from the system, including both successes (exits) and failures (shutting them down). This healthy steady state balance has helped buoy returns during this period (driven in part by scarcity of great companies), and demonstrated the value of early stage venture investing. Rather limited entrepreneurial pools grow but don’t have to expand hugely beyond their talent depth to staff young companies. The bar for ideas that get funding has remained very high. And early stage investor discipline in startup creation has stayed intact. This is not to say that the sector will remain balanced going forward: if funding flows into early-stage companies dramatically and sustainably increase (as may be hinted at in 2015’s funding levels), this could work its way into dramatically increasing the number of startups and triggering an unbalanced feed-forward investment cycle. Or the opposite could occur: dramatic reductions in funding could starve lots of new and emerging companies. But for now, and over the past few years, a favorable ecosystem equilibrium has been in place.
In contrast, the Tech ecosystem is clearly not in balance. Over the past few years, ballooning numbers of startups, fed with ever increasing amounts of capital, has led to a huge swelling of a bubbly ecosystem. Unfortunately, companies aren’t departing the system at a fast enough rate, either favorably via IPOs or M&As, or via disciplined shutdowns. Closed systems in nature can’t expand forever, and this one appears poised for dramatic changes – as Bill Gurley and many others have pointed out. Just working through the glut of startups, and the likely desperation moves of some, will take time for the tech sector.
Basic laws of supply and demand for ideas, talent, and capital play an important role in shaping all sectors, and right now these dynamics are particularly relevant in venture capital. It will be interesting to see how the next few years play out across the different venture sectors.


