


As larger Pharma externally-enables more of its pipelines, the cadence of biotech M&A appears to be accelerating, especially for early stage deals. Another week, another biotech acquisition in the news: Allergan has acquired two private and two public R&D-stage companies in just two weeks, involving Tobira, Vitae, Akama, and Retrosense. Exciting data from PARP inhibitors and immuno-oncology programs have catalyzed hopes of a further wave of acquisitions.
Demand from larger companies for innovation is a (the) major source of gravity in VC-backed biotech. More than half the venture-related exits in the past few years, even during the bull market for IPOs, were from M&A. At our firm, Atlas Venture, nearly two-thirds of our exits in recent years were M&A.
It’s also critical component for recycling capital to new and emerging stories. The $14B acquisition of Medivation by Pfizer alone will likely channel as much capital back into earlier stage biotech (in search of the next Medivation) as all of the IPO funding flows into the sector since the fall of 2013.
But not all acquisitions are like Medivation, or like the monster StemCentryx-AbbVie deal on the private side. As an investor in the space, having a good grasp of the “market” and context for M&A is important, both to be able to benchmark but also to see the macro trends around the scarcity of innovation and where negotiating leverage can help drive up returns.
To that end, I thought it useful to revisit the distribution range of valuations from M&A and how they changed over the last decade. Working with the platform at Pitchbook, who is now the NVCA’s preferred data partner (and a great help on analytics), we explored M&A values of VC-backed biotechs over time, focusing only on upfront payments.
Over the past decade, there were 325 M&A events in their dataset. As shown below, the entire distribution of upfront values has shifted upwards considerably over time. Median values have nearly doubled ($63M to $115M) for all M&A. Medians matter in portfolios of investments, and ensuring adequate returns even at median outcomes can strategically aid fund-level returns. At the high of the range, valuations have also soared: top quartile upfronts have moved up by 50%, from $215M to $310M, and top decile numbers have rocketed to north of $650M upfront.
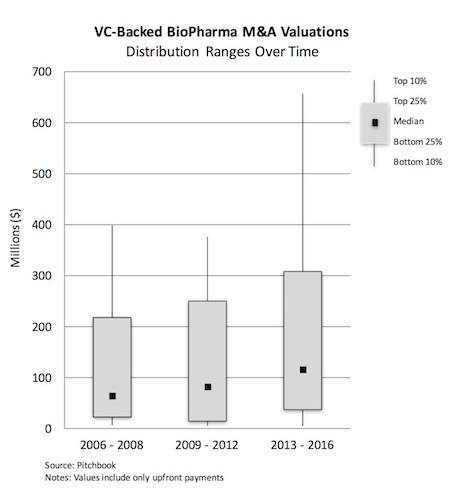
Of course, this distribution is skewed lower by the large number of immaterial exits, either quick sales or salvage deals around intellectual property in failed companies. To look more at the typical range for “winners”, examining only the 192 exits above $50M shifts those distribution ranges up considerably, as you would expect: medians move to top $225M, top quartile above $515M, and top decile above $920M – all significantly higher than the range of outcomes a decade ago.
Deal valuations have moved up such that today’s top quartile looks remarkably like yesterday’s top decile – which bodes well for driving up venture portfolio returns considerably in the sector.
Further, these Pitchbook data just represent the VC-backed private company biotech exits. The reality is a large number of R&D-stage companies went public in recent years – and lots of M&A is happening there too. Take one of the Allergan deals mentioned above: Vitae Pharmaceuticals, one of our portfolio companies, went public in 2014 and was acquired for nearly $640M.
To look at the combined public and private dataset of M&A, BMO Capital Markets kindly shared their extensive M&A dataset. They classified the lead program at the time of the exit, which enables a look at changes in M&A valuations over time by R&D stage. These data include both upfront payments and the contingent success milestones.
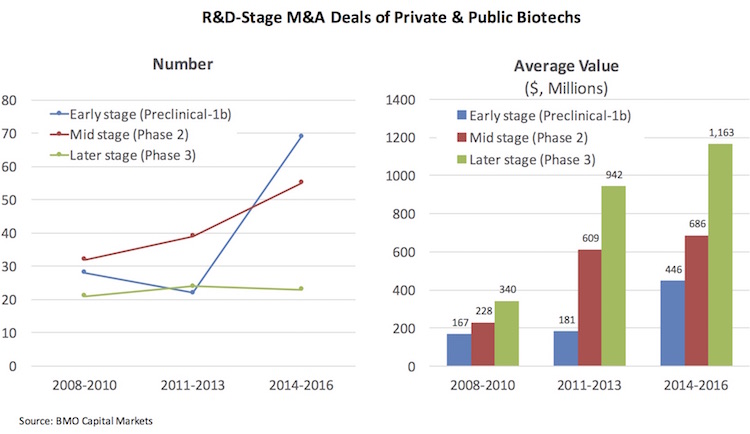
Two observations of these data: first, the number of early stage M&A deals has gone up considerably, while late stage Phase 3 deals have been flat (probably reflecting lack of inventory more than lack of interest). This reflects the accelerated cadence of early M&A, which we’ve benefited from recently with preclinical M&A deals at Padlock and CoStim, to name a few. Second, the average valuations of these deals, across all stages, have escalated significantly – especially in the recent few years. Preclinical and Phase 1 deals now average nearly $450M in upfront and milestone payments.
This upward trend is obviously a good thing for returns to investors and teams alike. Sometimes bittersweet, as these companies and their prized programs lose their identity inside of large Pharma, which Sam Truex highlighted in an earlier blog post.
Looking forward, the structural forces behind this rise in valuations for M&A deals remain strong and likely persistent: large companies need to externally-source a significant proportion of their pipelines (especially in light of the future pricing environment, as described here), and there’s a scarcity of startups and innovative assets in the market (which takes years to change, if it can be). Biotech M&A comes down to simple macroeconomics: supply and demand.
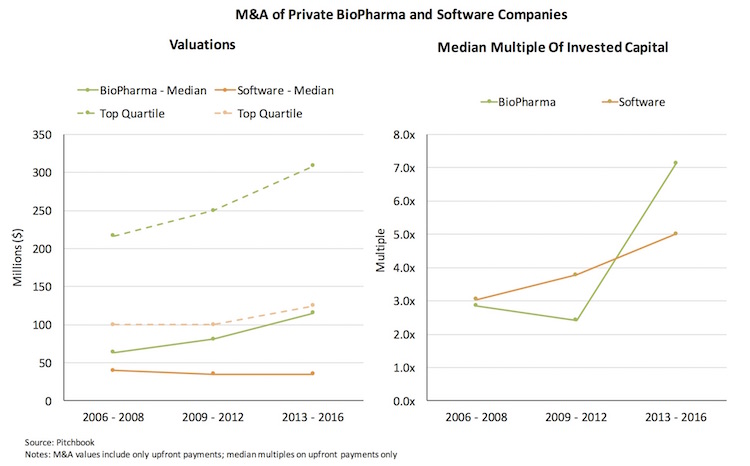
Before signing off, biotech venture doesn’t just exist in the life science world. We compete for LP capital, and are compared with other sectors in venture. To shed some light on the M&A trends in biotech relative to the largest tech venture sector, software, the team at Pitchbook helped look at distribution ranges of M&A in both – this time focusing on medians and top quartile values to simplify the chart.
A couple points worth noting in these data.
First, median and top quartile valuations in VC-backed biopharma have greatly exceeded those in software. Although not shown, even if you exclude all the small micro-acquisitions (like aqua-hires) and focus on “winning” exits greater than $50M, while a top quartile software M&A deal in 2013-2016 is a respectable $280M, that’s only about half of where biopharma deals have gone: over $515M at the top quartile.
Second, valuations are great, but returns are what really matters. There, too, the Pitchbook data shows the strong performance of biopharma: a decade ago, both software and biopharma’s median multiple of invested capital in M&A deals hovered around 2.8-3x; since 2013, both sectors have seen nice upticks in multiples – but biopharma’s median multiple has grown more, reaching above 7x, about 40% higher than median returns in software.
The recent venture dynamics in these two sectors are strikingly different with regards to the supply of new startups and the demand for them (M&A, IPO), as discussed previously; these differences are likely to continue to shape the performance of venture investing in these sectors.
For those biopharma folks about to rock (with M&A), we salute you.