It’s certainly not Breaking News that M&A deals are an important source of liquidity in biotech VC today. But last year did mark an important milestone for biotech over the past few years: in 2011, the capital returned to investors from private M&A alone likely exceeded the total capital invested into private biotech companies.
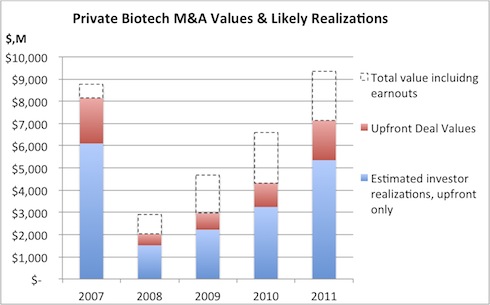
2011 was a banner year for private company M&A. Based on the data compiled by BioCentury, and Walter Yang in particular, deal values were up over 3x since the nadir of 2008. Here’s the snapshot:
- 64 private M&A deals, representing $23B in proceeds (upfronts and milestones). This includes great deals like Plexxikon, Calistoga, Amira, BioVex and Advanced BioHealing, among others.
- Only 45 of these 64 deals disclosed financial information
- Nycomed was worth $13.6B and was clearly not venture capital, so taking that out leaves $9.4B in total
- Several of the remaining deals had significant earnouts; removing these milestones leaves $7.1B (i.e., only upfront payments)
- If you assume that investors owned on average 75% of these exits, which is in line with ownership benchmarks, then an estimated $5.3B was realized last year from this set of disclosed deals.
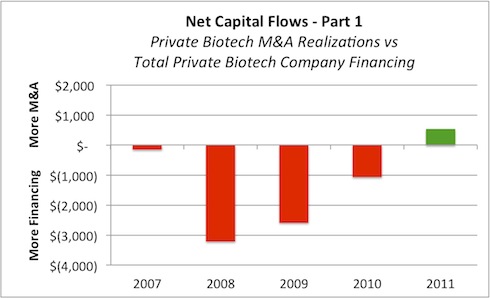
Comparing these capital flows to the biotech venture capital investment pace reveals a surplus of realizations. In 2011, again according to BioCentury’s database, $4.8B was invested in biotech venture capital deals (therapeutics only). Compared to the $5.3B in estimated realizations above, this yields a $500M surplus. By comparison, in 2008 over $3B more flowed into financings than M&A. The chart below captures the net capital flows between these two over time.
Having more realizations than investments is not remarkable; in fact, its critical for long term viability of a sector. But it is remarkable that just this set of disclosed M&A deals of private biotechs alone outpaced the total amount invested, and highlights how strong the biotech M&A market was in 2011. The reality of the full realization picture for biotech is obviously even better than these numbers: first, this M&A dataset doesn’t include any public equity realizations, so misses both sales by venture investors of post-IPO biotech stocks or public biotech acquisitions where VCs still had big positions (e.g., Burrill’s position in Pharmasset, NEA’s in Inhibitex). Second, many VCs also do PIPE investments and a number of these were big hits this year as well (e.g., Amarin). Third, as noted above, almost a third of the private M&A deals didn’t reveal their financials, clearly biasing the overall number lower.
This positive net capital flow by M&A in biotech is better than the relative impact of M&A on the aggregate, cross-sector venture landscape: according to the NVCA, $23B in venture-backed, disclosed M&A deals closed in 2011, so using the same assumptions that investors owned 75%, that would imply $17B in realizations. The early data on 2011’s total venture financings (from CBInsight) has the aggregate funding at $30B. The data might not be perfect, but it does suggest a large net-negative relative capital flow. A big caveat is that IPOs have played a big role in social media and IT in 2011, but when comparing relative M&A impact, its fair to say venture-backed biotech had a great 2011.
While it’s true that the amount returned and the amount invested in any given year aren’t directly related (i.e., one year’s exits represent capital invested over many prior years), the crossing of these trends in capital flows is quite positive and highlights the increasing investment realizations we’re getting in the life science venture world.
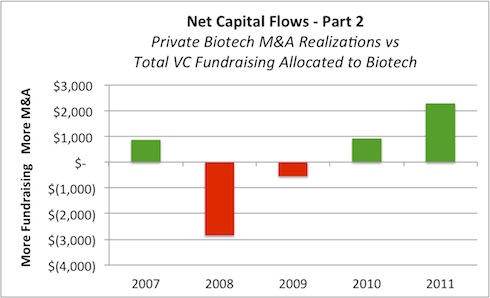
A second metric is also worth highlighting: the realizations from these 2011 M&A deals also outpaced the likely biotech allocation of recent venture capital fundraising. If one assumes that ~17% of all recent venture fundraising will go to biotech (in line with biotech’s share of venture investments over the past five years, according to MoneyTree), then last year’s $18.2B in venture fundraising will provide $3.1B in biotech allocations in these new funds. This is substantially less than the $5.3B in estimated returns. The chart below captures the net capital flows between these two over the past few years, trending favorably towards returning more capital after the challenging years of 2008-2009.
A caveat to this data is that the real gap probably isn’t this large, as corporate VCs don’t have to report their fundraising and play an important role in 20-30% of biotech venture financings.
In summary, 2011 was a solid year for biotech investor returns through M&A. As life science companies chalk up more exits, and both fundraising and fund sizes continue to be ‘right-sized’, its likely the this surplus of biotech realizations over both investment pace and fundraising will continue for the foreseeable future. This is a good thing for venture capital and our LP’s, and will hopefully bring a better appreciation of the merits of life science venture capital.
Special thanks to our friends at BioCentury (Karen Bernstein, David Flores, and Walter Yang) for the data supporting this analysis


