Much of the public dialogue about venture capital returns is based more on myth than fact, which reinforces inappropriately limited views of relative sector attractiveness, underlying risk profiles, and the “business models” that work in venture. A big part of the problem is that anecdotal stories about great returns drive much of the thinking. Another big contributor is that detailed venture data is hard to find and relatively few large datasets have been explored extensively.
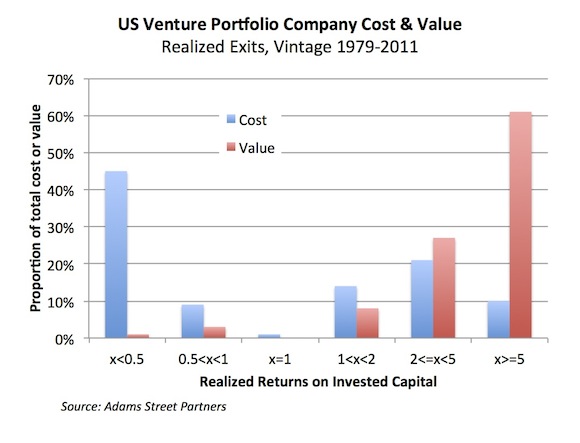
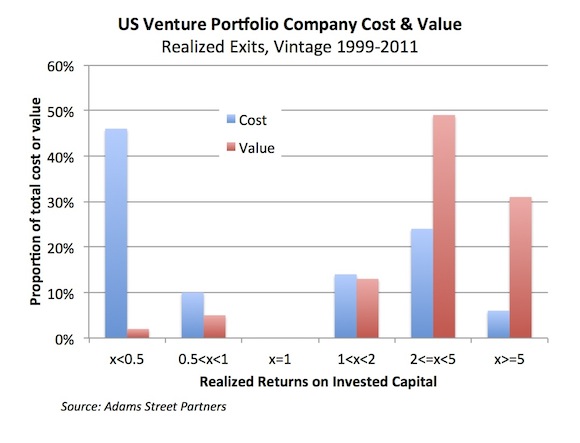
Fortunately, Adams Street Partners recently helped shed some light on this data gap with some interesting industry statistics, and I thought I’d call out a few points from their presentation. As context, they assembled a robust dataset examining over 5600 fully realized exits from 1979-2011, including over 2000 since 1999.
Some observations:
- The best performing deals are not creating as much relative value as they did in the past. The Top 10% of invested capital yielded 60% of the overall value created by venture between 1979-2011. In the most recent decade, these data suggest that the Top decile has only delivered about half as much of the value (about a third). The top three deciles in this recent period generated about 70% of the total value, also well shy of the 90% or so over the longer time period. However, despite differences in relative value created, the proportion of venture dollars yielding above 2x has been remarkably constant (~30%). These data suggest that it’s not the lower frequency of winners in general, but the lower frequency of outsized winners, that has dampened returns in the asset class.
- VCs haven’t been able to channel disproportionate capital into winners: the top venture-backed performers on a dollar-weighted basis are similar to those on a deal-weighted basis. The Top 3 best-returning deciles (Top 30%) on a dollar basis represent exits with return multiples above 2x. This is true over three decades (1979-2011) as well as just the past decade (1999-2011). The Top 10% is roughly above 4-5x returns, in line with data posted here previously that reflect deal-weighted metrics (here, via our Nature Biotech piece) and dollar-weighted metrics (here, Correlation Ventures). The lack of difference between dollar- and deal-weighted metrics implies that the winners don’t consume a dramatically different amount of capital (smaller or larger) than the typical deal.
- VCs aren’t any better or worse in past decade than VCs were in the distant past at avoiding losers: the dollar-weighted loss rate hasn’t changed much. Over both 10- and 30-year periods, share of dollars invested that go to losing deals has been roughly 55%. The capital-weighted loss rate has been 45-46% over these periods. This suggests that separating signal from noise (knowing what will work and what won’t) is hard when applying the traditional venture model of capitalizing startups: $10M Series A, $20M Series B, etc…. It also suggests that despite talk over the past decade about a “fail fast” model, few venture firms have done this successfully. At Atlas, across both Technology and Life Science franchises, we believe a seed-led, measured approach to investing can help us channel capital towards winners more effectively: we provide startups with small amounts of seed capital (<<$1M) to derisk their theses, and we watch for early ‘signal’ around team, product/technology, and market traction. We’re expecting our post-A-round capital-weighted loss rate to be far less than historic industry averages. Only time will tell.
- Life Sciences have a much lower loss ratio than most other sectors. These new Adam’s Street Partners data (no chart unfortunately) also show that while over 30-years the aggregate biotech sector returns are similar to internet deals (~2x), the dollar-weighted loss ratio in biotech is significantly less: ~36% vs ~59%, respectively, over the past 30 years. In English: biotech is far less lumpy than internet venture investing, far less dependent on the lottery ticket outlier. Despite a perception of “binary” bets in biotech, these data suggest that losing money in other sectors happens at a much higher rate than biotech. In practice this means that biotech investing is less random, where learnings can actually be applied to evolution of the investment model over time. We apply this thesis in our early stage LS strategy: taking disciplined approaches to capital titration, shaping the DNA of these companies through active startup roles, focusing on repeatable models for how to create new companies, find value-added corporate partners, etc… We aren’t just scratching off numbers on the MegaMillions ticket. We think we can repeatedly build companies with >5x return potential, and improve our odds of getting to those outcomes.
Some might ask why I focus this blog so much on the aggregate data. For me, these distribution curves define the asset class and help to frame the reality – or gravity – we need to work within. The venture capital field is full of great anecdotes and sadly these shape lots of the media and LP interest in the space: Groupon and Zynga at 100x+ were great anecdotes. I hope for their venture backers that they sold their shares a while ago otherwise much of those paper returns have evaporated. Biotech doesn’t make for good anecdotes despite lots of interesting winners. But one of my favorite quotes applies in spades to venture: “the plural of anecdote isn’t data.”
Informed by these historic curves, we can then ask ourselves the key question at the heart of venture capital going forward: how do we bend this distribution curve? We need a higher frequency of 5x+ winners. We need to avoid this high rate of dollar-weighted losses. As the business cliché goes, hope is not a strategy. Hoping reality changes without changing the way we invest isn’t smart. We need to push the venture model.


