The broad underperformance of the venture capital asset class during the past decade is widely discussed; there’s a frequently-cited assertion that U.S. venture returns trailed the overall public equity stock market in the 2000s.
Few if any published analyses have actually examined realized returns on a deal-by-deal basis using “apples to apples” cash investments in either venture-backed deals or public indices. The data mavens at Correlation Ventures have just shed some much needed light on this question, and their analysis at least in part challenges the conventional wisdom. They created a “theoretical S&P 500” investor who is assumed to have invested in the S&P500 index with the same amount of capital on the same days as the individual investments were made into venture-backed companies, and then sold their index positions on the same day as the venture-backed exit. This approximates the methodology of “Public Market Equivalent” (PME) analyses. One big difference is that most PME analyses include the “mark-to-market” paper valuations of unrealized, illiquid private companies; Correlation’s analysis focuses only on realized returns and “exits” – acquisitions, IPOs, and shutdowns.
[Update 11/19/13: To clarify questions about this dataset, here’s more information: From 2003-2012, this dataset captures 7976 realized deals across all venture sectors. This is an exit-year based analysis of individual deals, but includes the cash-in/cash-out invested over the life of that specific deal. Three types of realization classifications were used: out of business, M&A, or IPO. The distribution of outcomes: 39% went out of business, another 29% exited for less than their invested capital and hence lost money, and the remaining 32% were positive outcomes returning >1x, according to the Correlation database. This set of realized deals therefore is one of the largest datasets available, and reflects a representative return distribution of deal outcomes seen across the industry (with loss ratios and winning percentages similar to other analyses). Importantly, and repeated for purpose of clarity, this is not a “winners” only analysis, but reflects a large proportion of money losing deals (68% of the datapoints, in fact). Lastly, since unrealized deal valuations do not correlate well with final realized deal outcomes, this analysis reflects an interesting snapshot on deal-level performance in venture. While not a fund-level analysis, which is the ultimate measure for LP’s, it remains an informative and thought-provoking analysis of one of the largest venture industry datasets.]
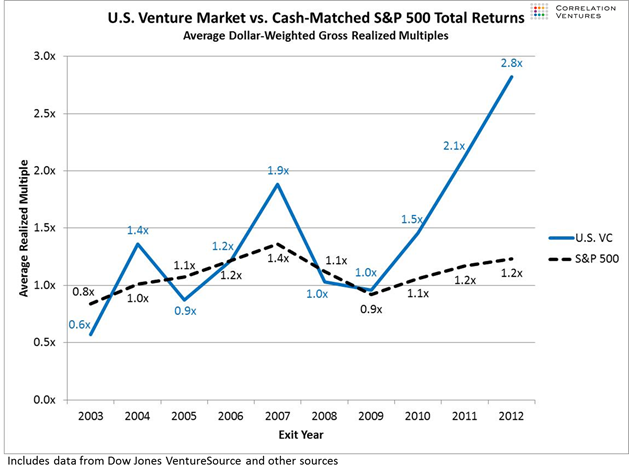
The chart below captures overall U.S. Venture Capital performance (blue line) relative to this theoretical S&P500 investor (dashed line).
The team at Correlation makes two conclusions:
Gross realized multiples have been much higher for U.S. venture investors than for an “apples-to-apples” S&P 500 investor in each of the past few years, and the average realized multiple for the past decade (2003-2012) was 36% higher for U.S. venture than for the S&P 500 investor…. Please note that when we estimate “net” returns (i.e., including fees and/or carry), U.S. venture has still significantly outperformed public equities in recent years.
Average realized multiples for U.S. venture have significantly increased during the past three years. This is consistent with our hypothesis that returns should increase as the significant overcapitalization of the industry that occurred in 1999 and 2000 exits the system.
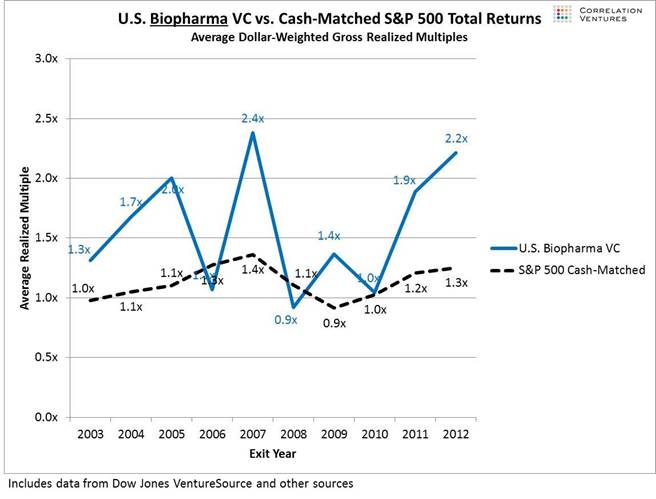
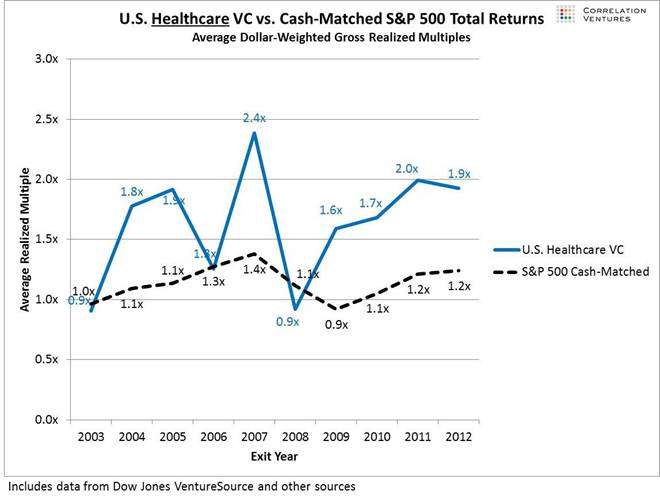
As a healthcare and specifically biotech investor, I’m particularly interested in those cuts of the above analysis. Appended below are those two charts. Just like in the broader venture asset class, the realized returns in biotech and healthcare as a whole outperformed the cash-matched theoretical S&P500 investor. This isn’t surprising given prior analyses highlighting biotech and healthcare’s above-average performance vs other venture sectors in the 2000s (here, here, here).
In 2010-2012, other venture sectors have contributed more to outperformance than biotech; this is most likely due to some very large social media and consumer realizations/IPO’s in that period. Given the current excitement around the biotech IPO window, I would expect biopharma’s numbers to look quite strong when 2013 statistics are included.
Its not clear exactly why these findings appear different than the analysis by Kauffman in 2012 (report here, discussed here); the authors of that report share data showing an underperformance relative to public markets of a large basket of venture funds in their portfolio. I haven’t explored the underlying methodological differences between this Correlation Ventures’ analysis and the Kauffman report, but a big difference is evident on the surface related to realized vs unrealized returns. This Correlation analysis focuses on realized exits in the year they exited on a deal-by-deal basis, vs the Kauffman analysis’ focus on venture funds themselves and therefore in a vintage year (birth year) manner, which at least in the past decade must include a large number of unrealized “paper” investments (companies that are still alive). Realized returns have beaten unrealized returns for exits in the 2000s (see first figure of post here), so this certainly explains some of the more positive Correlation findings. Importantly, LP’s don’t just care about realized returns – the drag on a fund from unrealized zombie portfolio companies is presumably significant for both of these analyses to be true. Furthermore, most bubble vintage funds of 1999-2001 have struggled to escape the craters of that period; any exit analysis focused on 2003 and later exits implies by definition that those companies were either ‘born’ after or were successful survivors of that period.
Thanks again to the Correlation Venture’s team for sharing their data with the world. For about their firm and data-driven approach to venture capital, check them out here.


