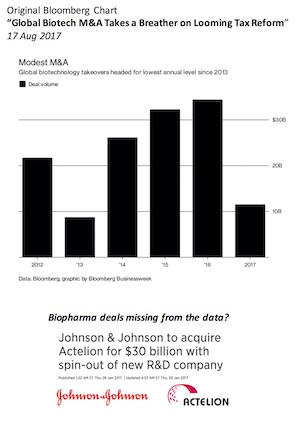
Last month, Bloomberg bemoaned the dearth of biotech M&A, and pundits echoed the sentiment (here, here), citing concerns about tax rates and drug pricing.
The top line numbers in Bloomberg’s graph certainly paint a dim view of 2017’s global  biotech acquisition activity, though I might quibble with the underlying data if I got a chance to engage on it. For instance, they show “global biotech” M&A activity in 2016 at ~$35B and 2017 at $11.5B. Where’s Actelion’s $30B takeout by J&J, announced in 2016 and closed in 2017? It appears, after connecting with the author, that part of this discrepancy involves what industry classifications define as “biotech” and what’s not. For data geeks, Pharma and Biotech have different GICS/SIC codes, which is of course more archeology about the fields decades ago than reality today. After all, Actelion Pharmaceuticals called itself a “Pharma” company in its moniker. But Pharma also includes the acquisition of Allergan’s generics business, which is clearly not biotech. It’s not simple to disaggregate – and to me, this all just highlights the importance of data curation and perspective.
So, data semantics aside, where’s that leave the “actual” status of biotech M&A today?
Big mega-deals are indeed down, though Kite’s $11.9B acquisition certainly throws some fuel into the M&A fire. Earlier this year, I had speculated that some of the big rising stars would get acquired this year (e.g., Incyte, Alexion, BioMarin, Tesaro), and we’d see at least five transactions greater than $5B. We’re only at two right now by my count (Ariad and Kite), so we’ve got some work to do.
But M&A isn’t just about mega-deals with multi-billion dollar public biotech companies.
To highlight some of the nuance, I took at crack at two different data cuts: overall R&D-stage M&A and private company M&A. Both analyses paint an alternative view of the M&A landscape.
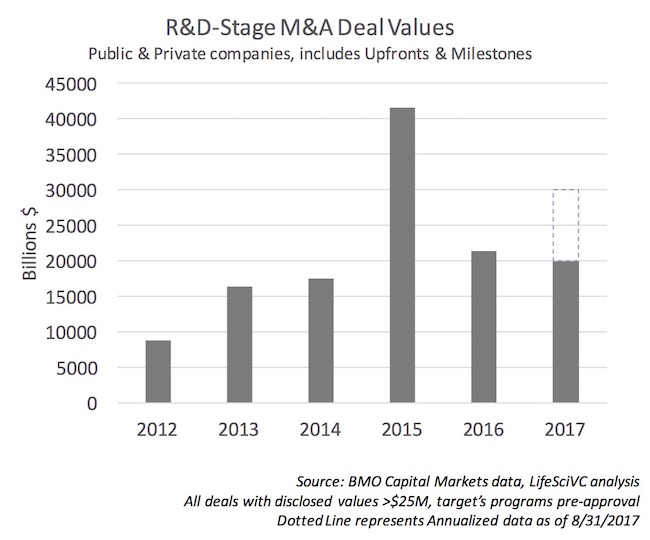
R&D-stage M&A. Leveraging data kindly shared by Annette Grimaldi and her colleagues at BMO Capital Markets, the amount of M&A activity over the last few years for R&D-stage biopharma companies was examined. By “R&D-stage”, this includes public and private companies where the target has no approved agents yet. Kite’s acquisition fits this as their axicabtagene ciloleucel NDA hasn’t yet been approved. Licensing and rights deals are also excluded. Here’s the data:
As shown above, R&D-stage M&A in 2017 is tracking towards the 2nd largest annual M&A pace in recent years. 2015 was a gangbuster year with a significant amount of R&D-stage deal activity, including Receptos, Synageva, Acerta, Auspex and others. 2016, despite the Bloomberg topline, was actually not as strong on R&D-stage M&A, and last year will almost certainly trail 2017.
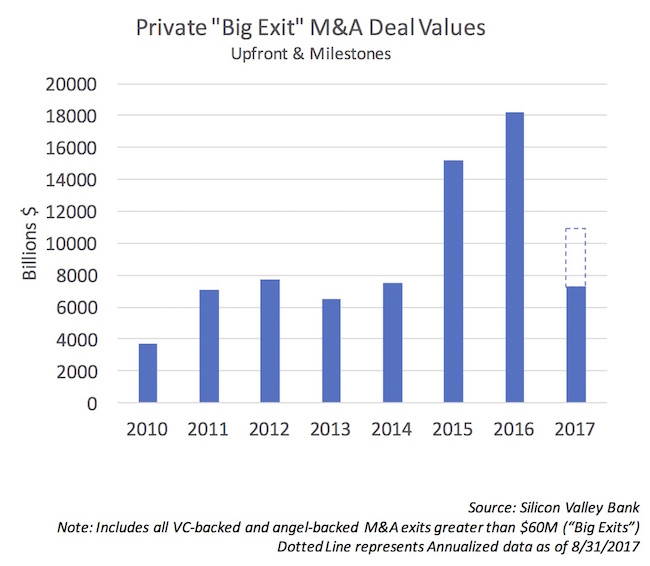
Private biopharma M&A. Jon Norris and Caitlin Tolman of Silicon Valley Bank maintain an excellent curated dataset of private biopharma M&A deals with upfront payments larger than $60M. This “Big Exit” dataset includes both VC-backed and angel-backed private companies, though is dominated by the former. Here’s the last few years of SVB’s Big Exit data, inclusive of total deal value:
2017 is off to a slower start than 2015-2016, but is pacing to be ~30% above 2010-2014 annual numbers for total deal value (upfronts and milestones). That said, the numbers of Big Exits are small (11-19 deals per year in this dataset), and therefore biased heavily to single large deals: in 2016, AbbVie’s purchase of StemCentryx was for up to $9B in deal value ($5.8B upfront). Excluding that single deal from the analysis, and 2017 is pacing to be a better year than 2016 for total M&A value.
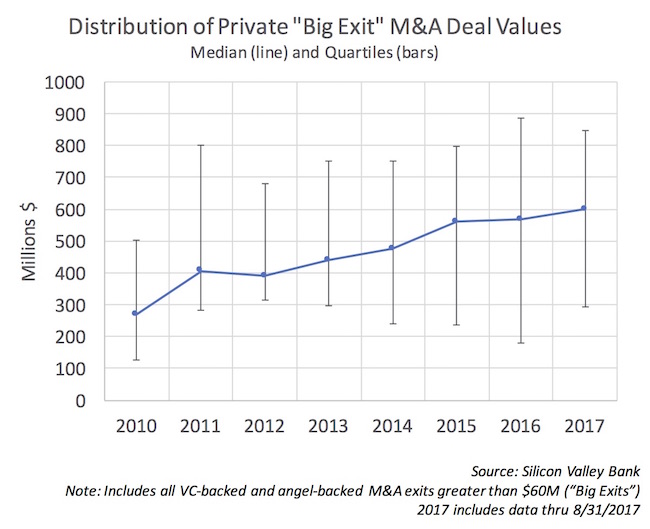
Importantly, though, the overall distribution of value in M&A, inclusive of biobucks (future contingent milestones) has gone up over time, peaking out in 2017 at the median value of $600M for the first time ever. The steady rise of the “typical” Big Exit value (aka the median) is impressive.
These analyses certainly reveal a more nuanced perspective M&A scene than the Bloomberg top-line chart: while 2017 isn’t blowing the doors off, there’s ample reasons to be positive about the underlying activity and pace.
They also highlight how lumpy M&A data are, and the need to use caution when seeing aggregate metrics. Definitions also matter (what type of deals are we really talking about). As noted above, StemCentryx in 2016 dramatically impacts both R&D-stage and private company M&A. Kite’s recent acquisition does the same for R&D-stage data in 2017. The reality is annual numbers, which add up to less than a few dozen datapoints, can be distorted quickly by outliers. While venture capital is an asset class of outliers (i.e., the big ones matter a lot), by pooling the underlying data into annual stats it is easy to lose a real sense for the prevailing sentiment and activity levels – which is why the distribution analysis in the third chart is important (the medians don’t swing as much).
Lastly, from one venture firm’s viewpoint, we continue to see larger biopharma companies engaged in active BD and M&A processes across the portfolio – with the acquisitions of Delinia by Celgene, IFM by BMS, and Infacare by Mallingkrodt earlier in 2017, along with an option-to-buy deal at LTI with Allergan back in January.
Truly innovative programs in biotech remain scarce, supply-constrained assets and, with increasing levels of external R&D sourcing by larger companies, we’ve found significant interest in M&A across the board. The drivers behind this demand are unlikely to change in the near-term, and sentiment toward deal-making in the day-to-day trenches of biopharma seems very positive. I suspect other early stage venture firms are witnessing similar dynamics.
Will be interesting to see how the year ends up on the M&A front.


