


The cost of making a new drug has grown to nearly $2.6B, according to the latest and greatest from Tufts Center for the Study of Drug Development (here). That’s a big and almost unfathomable number. Critics immediately pounced on it, calling anyone who believed it a flatlander (here), and suggesting that the cost, with failures, was closer to $150M. Tufts’ number appears incredulous, but the critics paltry number even more so.
Last time I weighed in on this subject back in 2011, an article in Slate suggested that the cost of a drug was $50M. I put out a model so that readers could “choose their own adventure” and play with the assumptions around drug R&D (here). It provoked some good commentary and engagement.
Although not much has been shared from the Tuft’s study, other than a backgrounder and a slide deck, I thought I’d review the assumptions required for the modeling. The estimates used by Tufts in prior analyses have already been independently verified by others (here), and this blog won’t be nearly as rigorous.
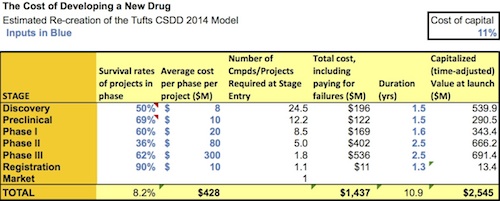
At first principles, there are several items that need to be factored in: direct costs of moving a drug forward, paying for failures along the way, and the time value of money (forgoing other investments). Since they haven’t shared their model, I’ve built a quick-and-dirty version using their public assumptions to recreate in a ballpark fashion their $2.5B drug cost estimate. The distribution of costs (30-33% of spending into pre-clinical phases) is similar to their report. Here is my “estimated” model that you can download and play with (here), with a snapshot below:
Observations on the key assumptions:
- Attrition: Rates Of Program Success. The numbers the Tuft’s report uses are very much in line with other recent publications from the BIO organization in the January 2014 issue of Nature Biotechnology (here), McKinsey’s 2010 anatomy of attrition (here), AstraZeneca’s recent 2014 lessons learned in Nature Reviews Drug Discovery (here), or Eli Lilly’s 2010 review of the “grand challenge” in the same journal (here). So it’s hard to argue with these estimates. A general consensus set of attrition numbers leads one to cumulative probability of around 8% give or take for getting a Development Candidate to approval. Obviously first-in-class drugs have higher rates of failure, especially in Phase 2a, but the blended numbers Tufts uses are very reasonable.
- Timelines: Duration of Each Phase. Again, in line with attrition rates, its hard to argue with their timelines that suggest, on average, drugs take ~8 years from first-in-man studies to approval. There are clearly some that are faster (e.g., Zelboraf, Xalkori, and Imbruvica all went from FIM to approval in less than five years, here) and some are slower (e.g., many of the 2011 FDA approvals were discovered in the 1990s here). So Tufts timelines are reasonable representations of the average.
- Costs: Direct Spend on Projects. These assumptions are very big factors in the model, as one might guess. This is where using the average is potentially distorting, and probably the weakest part of any broad industry analysis like this. Tufts doesn’t reveal the exact costs estimates, but they apparently built their cost assumptions from 106 drugs from ten large pharmaceutical companies first tested in the clinic between 1995-2007 that advanced through the various phases. Based on that approach, these cost assumptions are undoubtedly biased towards Big Pharma programs targeting broader diseases, as the targeted/orphan theme didn’t receive as much Big Pharma attention pre-2007 as it does today.
So while the attrition and time estimates seem reasonable, the big question in my mind is whether cost numbers in this range are valid representative estimates for the drug industry at large?
At first glance they don’t seem far off from reality for a mid- to large-sized Pharma company or a reasonably large indication requiring a few thousand patients to get approved. The model suggests direct single program costs for an average drug of $400-500M to get to approval. Seems credible, at the average, though well in excess of the costs to bring an orphan drug with a 75-patient package to approval (like the Increlex approval in Laron Syndrome), and well shy of the primary care mega-drug requiring 20-30,000 patient exposures before approval. But since less than half of the new drugs approved by the FDA are from Big 20 Pharma, if their R&D numbers are skewed towards the bigger firms, then they probably aren’t the right cost assumptions to use for making generalizations about the entire industry.
To further pressure test these cost assumptions, lets do a quick top-down and bottom-up comparison of the R&D spend.
- Top-down. The industry spends ~$100B in R&D each year (including the $70M or so from Big 20 Pharma, $25B from all other public companies in biopharma, and the $5B a year spent by VC-backed biotechs, highlighted here). About since 25% of this aggregate number goes to Life Cycle Management of existing products (e.g., new indications and Phase IV studies), that leaves about $75B spend on “new drug R&D”. At 25-40 FDA NME approvals per year, that’s about $2-3B weighted cost per NME approval – in the ballpark of the Tufts analysis and of Matt Herper’s 2012 Forbes piece using a similar top down approach (here).
- Bottom-up. The PhRMA organization publishes the number of medicines in the industry pipeline – 5408 drugs according to the recent report (here), not inclusive of discovery and preclinical. The phases of these medicines are in the pie chart on the cover of the report. Using the annualized cost estimates by phase in my estimate of the Tufts “model” above, and ignoring the thousands of drugs being studied in discovery and preclinical phases, implies a bottom-up annual spending by the industry of at least ~$200B.
The big 1.5x discrepancy between this top-down (what the industry actually spends) and bottom-up (implied costs accrued by drugs per phase) analysis suggests a few things: either the numbers on the industry’s pipeline from PhRMA for are vastly inflated or include non-NME programs, or that the development cost estimates I’ve used to recreate the Tufts model aren’t fully reflective of the entire big-and-small Pharma industry. My guess is that its far more of the former than than latter, but both of these conclusions probably have some merit.
Lastly, its worth noting that like any industry-wide general analysis, the assumptions required to derive the “average cost to bring a drug to approval” require fitting drug R&D into a normal distribution (certainly not right) and using single point values that frankly aren’t that instructive. So in short, these models can only be specifically wrong and generally right. But they are better than nothing, and frame up the scale of the challenge.
As a second final note, it’s worth mentioning that the tax-shielding benefit of R&D spending isn’t included in the model from Tufts to my knowledge. If you assume a 25% effective rate, the numbers are in Tufts estimates can be reduced by a quarter; the numbers are still large, but it’s probably fair to include the these in a fully capitalized financial model of drug costs. Tax inversion deals would, of course, reduce the magnitude of tax-shielding by R&D; good thing they are going the way of the dodo.
No analysis is perfect. If Tufts estimate is off the mark for the entire industry, it doesn’t appear off by a huge amount, and certainly not the order of magnitude implied by the critics. Most practitioners in the field agree on the general rather than specific conclusion: the cost to bring a drug to market is big – very big – especially when accounting for all the failed attempts. If we want to reduce this number, the solution is simple – just do things better, faster, and cheaper. Back to work.