


Biotech fills the news these days – whether it’s the announcement of exciting new clinical data, another high-flying IPO, or a big M&A deal. Amidst the significant “share of voice” in the coverage of young and emerging biotech in the media, it’s easy to forget the relative scale of the sector relative to larger BioPharma companies.
Here’s a three-part graphic aimed at framing these David-and-Goliath size differences. Market cap’s reflect the VC-backed biotech IPOs of the 2013-2014 window compared to the top 30 largest global BioPharma companies. Below that the R&D spending of those same thirty companies is compared to the private VC funding into biotech (a good proxy for annual “R&D” spend by biotech’s involved in product development, funding about ~500 biotech companies annually). And lastly is a bar chart reflecting the scale of the cash positions on those thirty balance sheets versus the amount raised during the “largest IPO window in biotech history” for all US-based biotech firms, as well as a narrower definition of NVCA’s VC-backed biotechs.
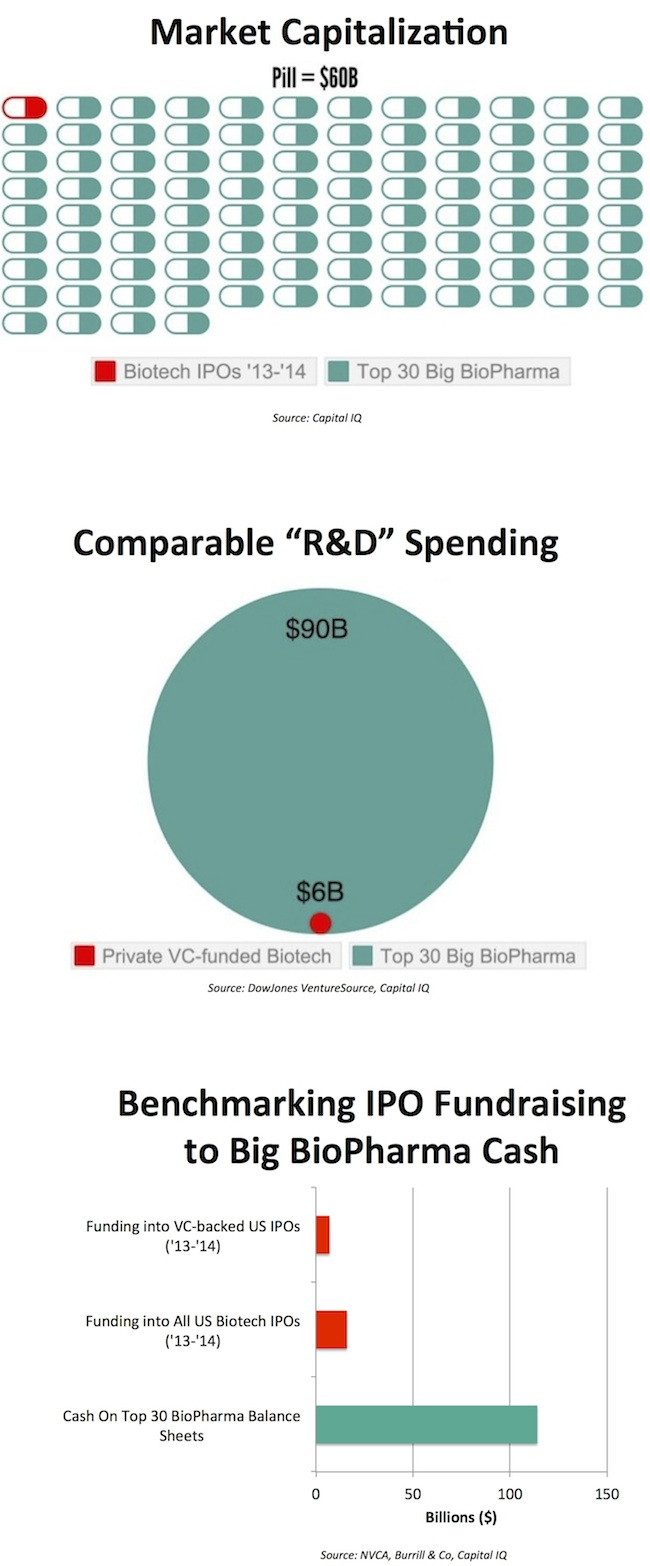
What’s the point of all of this, beyond the joy of looking at data itself?
First, stating the spectacularly obvious, it’s clear that biotech is a tiny fraction of the scale of the bigger BioPharma part of the sector in every major financial dimension. Small percentile changes to a Big BioPharma company’s market cap swamp the scale of the biotech sector. For instance, Biogen’s initial Alzheimer’s antibody data earlier in January moved the value of the company upward by ~$10B.
Second, because of this scale difference, even small changes in the resource allocation practices within large Pharma companies offer the potential to dramatically alter the biotech ecosystem. Assume these Big BioPharma companies channeled just ~5% of their balance sheet cash (roughly the “draw” on a typical “endowment”) into private biotech companies – this capital flow would fully fund the entire VC-backed biotech sector for a year (~500 companies). Minor changes in the internal vs external R&D allocation would have similar effects. And with market cap differentials this large, the cost-of-capital is staggeringly different across the ends of the BioPharma spectrum.
Third, this differential in size makes Pharma’s increasing “externalization” of their R&D functions (via partnerships and M&A) a significant financial “buffer” against the cyclic ups and downs of the public capital markets. For sure this IPO window for the past eight quarters has been a boon for companies and for returns, and we all hope for it to continue, but it is not immune to the natural capital cycles – there will be both bears and bulls in the future. Big BioPharma’s massive financial scale, captured in the charts above, and their unrelenting appetite for biomedical innovation, provides a healthy long-term foundation for the biotech sector.