


Over the past decade, in contrast to widely held misperceptions, the Biotech sector has witnessed time-to-IPO metrics very similar to other venture sectors, as I recently blogged on regarding the 2014 IPO Class (here).
What wasn’t covered in the prior post was the other half of the “exit” equation – M&A events – and these data are now shared below.
The high level conclusion is once again very similar, as Biotech holds its own on these metrics as well. In fact, for exits with disclosed values bigger than $50M, Biotech appears to have shorter holding periods in this vintage, as it was for larger M&A deals in the 2009-2013 vintage (here).
Thanks again to data from NVCA and Thomson Reuters, their 2014 set of VC-backed M&A events served as the basis for this analysis. According to these data, there were 461 venture-backed companies that were acquired in 2014.
To put this in context, this is nearly 4x more exit events than IPOs last year. As was noted in a post last fall, even in this bullish IPO market, liquidity continues to be significantly driven by M&A activity (here).
Interestingly, while Biotech dominates the IPO numbers (56% of the offerings, here), its dwarfed by Software exits on the M&A front: Biotech companies only represent 8% of the M&A deals vs 43% in Software. This reflects the huge volume of small micro-cap acquisitions (also called Acqui-hires) of startups in the Software and coding world.
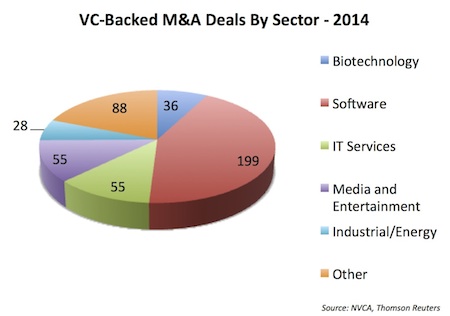
A further nuance in the data is worth noting – if you compare only the number of M&A deals with disclosed values, the numbers equalize quickly: 25/36 Biotech deals and 34/199 Software deals had specific M&A values disclosed at the time of the transaction.
As with the prior IPO dataset, the ThomsonOne data track the initial venture investment date for most of these companies and therefore the specific “time from first investment to M&A” can be calculated. The charts below depict the summary distribution (once again with terminal deciles, quartiles, and measures of central tendency) of three subsets: all the M&A deals for VC-backed companies, all the M&A deals with disclosed values, and all the M&A deals with disclosed values above $50M.
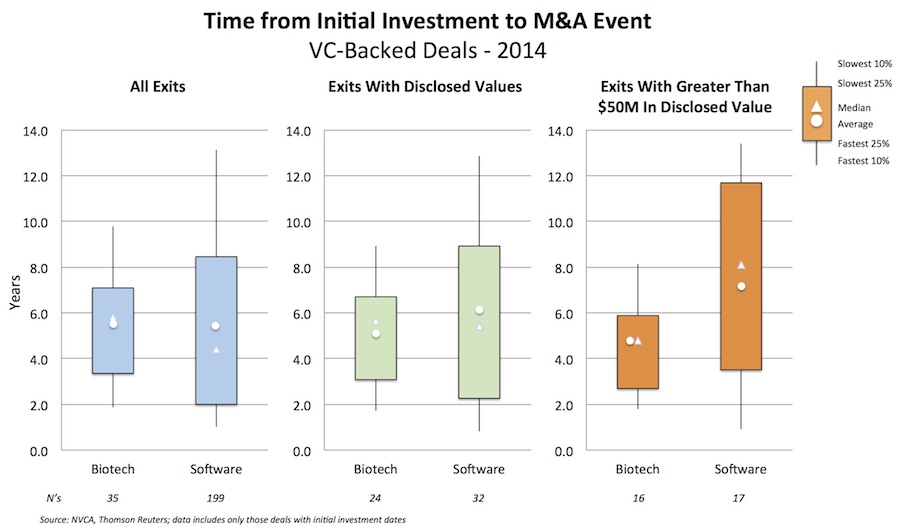
There are at least three observations from these data:
- Looking at all the M&A deals in the dataset (left graph), the distribution is slightly skewed earlier for younger Software exits, reflecting the large number of micro-cap undisclosed acquisitions/Acqui-hires: the median and average time to exit in Software’ is 4.4 and 5.7 years, respectively, vs Biotech’s 5.8 and 5.7 years, respectively.
- For deals with any disclosed M&A values (middle graph), the data are roughly the same across both sectors: the median and average time to exit in Software is 5.4 and 6.1, respectively, vs Biotech’s 5.7 and 5.3, respectively. These are clearly quite similar, though Software’s distribution around the mean is much wider (at both the longer and shorter end).
- Lastly, for deals where the M&A value is bigger than $50M (right graph), the distribution strongly favors the Biotech cohort by more than a couple years. The median and average time to exit in Software for these larger disclosed deals is 8.1 and 7.4 years, respectively, vs Biotech’s 4.8 and 4.8 years, respectively. Several quick, large biotech exits occurred last year, like Labrys, Seragon, and Lumena.
This last observation implies that larger Software exits take more time to mature than Biotech deals of similar magnitude in this cohort, which confirms prior data from the 2009-2013 vintages (here). This likely reflects many of the same reasons that enable Biotech companies to go public at a younger age (i.e., the promise of strong early data), whereas bigger Software M&As and IPOs typically require larger, quarter-over-quarter growth businesses.
As a final point, these 2014 time-to-IPO data across both sectors appear similar to that during the 2009-2013 vintages – whatever froth there may be in the markets today isn’t dramatically speeding up bigger exits across either sector.
So to conclude, like the IPO dataset recently examined, the Biotech sector appears to outperform expectations vs other venture sectors on the exit race track.