


Biotech has been on a tear over the past few years supported by a combination of scientific advances, great IPO and M&A exit environments, and robust capital markets for fundraising. Watching the public indices gives a good indicator of broader returns in the public equity ecosystem, but getting a handle on private venture capital returns is much harder.
As background, a few years ago Bijan Salehizadeh of NaviMed Capital and I called Life Science investing the “Rodney Dangerfield of venture capital”- a sector getting no respect. That blog post came after publishing a piece in the July 2011 issue of Nature Biotechnology detailing the differences in returns between Life Sciences and Tech investing during the 2001-2010 period. We used the NVCA Benchmarking Database powered by Cambridge Associates (C|A). This was and continues to be one of the most robust databases of its kind – covering returns from nearly 1300 firms over the past 30 years of venture capital. It’s not the entire universe, but is a large enough sample set to get a good handle on metrics. In that analysis, we followed NVCA and C|A definitions in our query: “pooled” data is the aggregation of the deals in the time period in one dataset, “pooled returns” measure aggregate deal performance, “realized” deals are ones that have been exited, and “gross” returns are not net of fees or incentive compensation.
We’ve got a new cut of the recent data using the same approach as before. For investments from 2011-2015, the analysis below looks at US venture capital returns at the company level as of March 31, 2015. A few key takeaways are apparent.
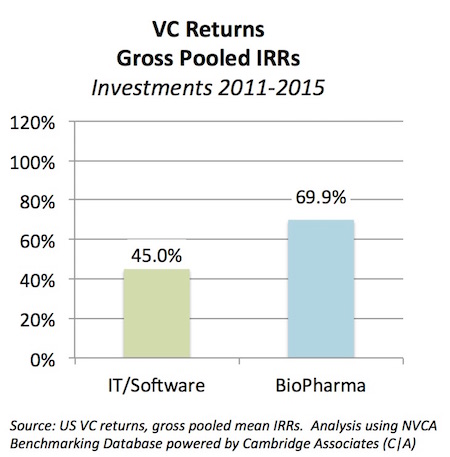
Biopharma venture investing has indeed been on fire from 2011-2015. The gross pooled IRR for biopharma investments made between 2011-2015 is a whopping 69.9%, whereas IT/software venture investing was 45.0%. Healthcare sector as a whole (inclusive of biopharma and a diverse set of HCIT, devices, medtech, and healthcare services) posted 50.5% over the same period. BioPharma investing has clearly been red hot.
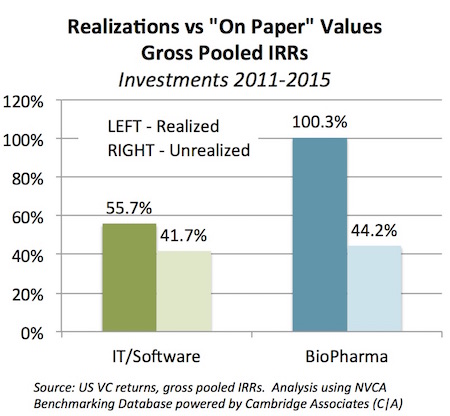
Realizations have been very strong in BioPharma. Realized returns – those generated from exits like M&A or publicly-traded stock following an IPO – greatly favor biopharma during this recent period: realized gross pooled IRRs topped 100%, almost double IT/software. Unrealized returns are largely the same across the sectors.
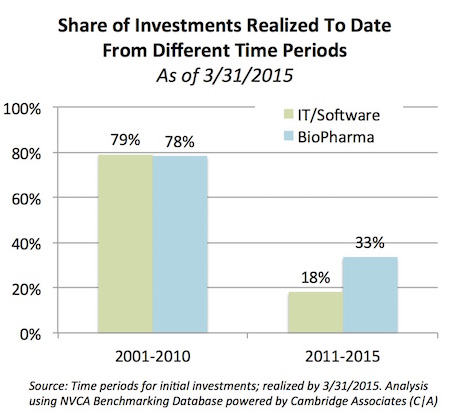
It’s worth noting that the pace of realizations from deals in the 2000s is roughly the same. For investments made between 2001-2010, nearly 80% of them have been realized at this point across both sectors. However, looking at the more recent period, biopharma exits have outpaced IT/software by 2x – 33% of the biopharma investments made since 2011 are already “realized” as exits vs 18% in IT/software. These aren’t small n’s either – some 216 biopharma investments were made and exited in the period. This is a striking observation, and reflects a further tightening of the holding period data in biopharma (which is good for capital velocity and IRR calculations).
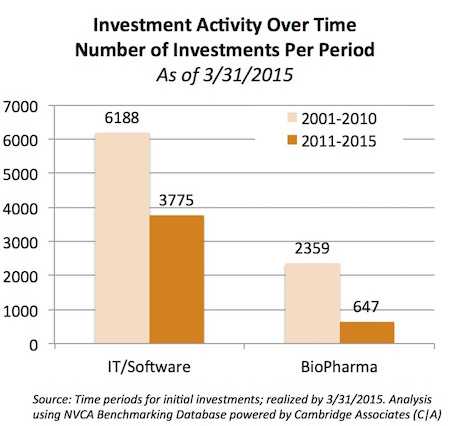
These new data also highlight the glut of tech deals. Of all the IT/software investments in the C|A database from 2001-2015, a full 38% (3775/9963) were made in the past four years (since 2011). By comparison, this period in biopharma only represents 22% of the investing activity over the past 15 years (647/3006 deals). This reflects the rapid pace of startup creation in tech venture in the past few years, contrasted with the steady/slow pace in biopharma (as written about here, here, here).
Lastly, it’s worth noting that longer-term venture capital IRRs have improved in both the biopharma and technology sectors. Recall that in our prior analysis, biopharma had gross pooled IRRs of 8-13% during the 2001-2010 period vs IT/software of 3.5-4.5% (Figure 1b). Taking a 15-year view of the data (2001-2015), both sectors improve: bioPharma moves up to a 16.3% gross pooled IRR and IT/software to 17.5%. The dramatic improvements in the latter are largely due to some major realizations in the 2011-2015 period for investments made in the 2000s, like Facebook’s 2012 IPO and Twitter’s 2013 IPO. Because the analysis uses pooled returns, the huge size of those wins has a considerable impact on the statistics. But the great news in all of this is that returns have been increasing, even for older companies that have been maturing into better valuations. This upward trend in venture returns has been a big contributor to increased LP interest in the new venture capital fundraisings: 2014 saw $30B flow into new VC funds, and 2Q 2015 saw $10B alone – both marking the highest levels of VC fundraising in eight years (here).
The last couple years of biotech’s bullrun have helped to dispel some of the anti-biotech myths in the venture business, but many still exist (like many of these here). It’s nice to see the recent data making such a strong case.
Many thanks to Bijan Salehizadeh of NaviMed Capital for driving the data analysis.