


With the NASDAQ sector indices still up 17% for the year, and IPOs continuing at a robust pace, the biotech investing climate continues to be an exciting one.
Amidst these rising stock prices, or at least perceptions, I frequently get asked about whether this euphoria is moving back into early stage venture round valuations. By and large, it hadn’t felt that way until recently, but that story is getting more complicated.
Using data derived from Pitchbook, I’ve analyzed 5-year trends in pre-money valuations across early rounds (seed/Series A’s) and later rounds (Series B/C/Ds). Pitchbook has an extensive set of company valuation data across the venture space, including biotech; each annual datapoint has 100-200 individual deals in it. Further, pre- and post-money valuations for biotech IPOs in this period were also compiled, from BMO Capital Markets data, and compared to the private metrics. This combined dataset let me address valuations over time. Here are a few conclusions.
Pre-money valuations for biotech’s have, as you might expect, have moved up across the board – early, later, and IPO stages.
The chart below compares the median and top quartile figures, normalized to the median 2010 datapoint for their respective pair (early seed/A’s, later B/C/Ds, and IPOs).
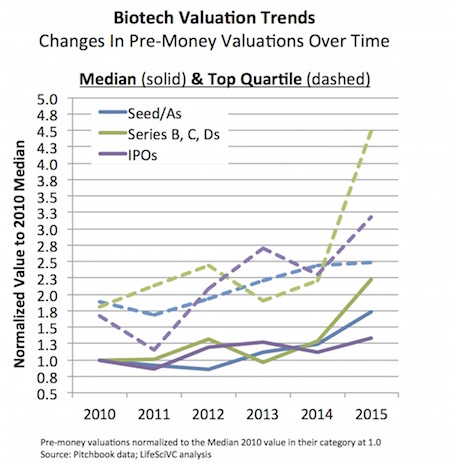
Two observations:
First, the biggest change that leaps out in these data are the upswing in later stage private valuations: top quartile and median pre-money valuations are up 250% and 220%, respectively, when compared to similar top quartile deals in 2010. This reflects the significant demand for highly attractive private stories amongst crossover investors. IPO pre-money valuations are also up considerably for top quartile deals (90% higher) but interestingly, even in this bullish market, the median IPO pre-money valuation is up only modestly (30% since 2010). And seed/Series A top quartile rounds actually rose slower than the median valuations at this stage, which have jumped in 2015 (off of a very low single-digit million base).
Second, most of the upswing has come in the past twelve months. The median pre-money valuations in particular were only modestly changed from 2010-2014. But this year things have moved up considerably, especially later rounds and top quartile “premium” IPOs.
Pre-money is only half the story: capital raised has also been changing.
It’s the combination of a company’s pre-money and the amount it raises that determines the dilution its shareholders face: essentially, how much of the post-money is owned by prior owners versus new ones. This has been quite steady in same categories, but significantly different in others. The chart below captures the share of the post-financing value attributed to the pre-money (e.g. one minus this percentage is the amount of the company they had to sell to raise the capital).
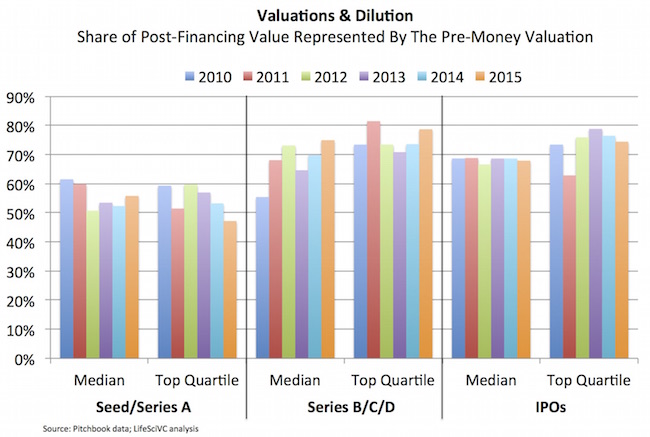
A couple thoughts here too:
First, IPO dilution is quite constant. The median IPO pre-money has been very tight, between 67-69% of the post-money, in each of the last five years. Top quartile IPOs have typically sold ~25% of their company in the offering. If you ever did wonder if bankers just have a formula for the “typical” IPO and the amount they raise, have no doubt – its clear they do: sell 32% of your company if you are a typical story, ratchet back to ~25% if you are over-subscribed.
Second, top quartile early stage rounds are raising more capital and taking more dilution, on average, as a consequence in their first tranche/round of financing. Instead of retaining 60% or so of the company, that figure has dropped in 2015 to under 50%, a meaningful reduction in ownership in my opinion at an early point in the company’s life. Worth noting a caveat in the analysis here: I’ve assumed a top quartile pre-money valuation is associated with a top quartile fundraise, which may not always be the case.
Third, as a contrast, the “typical” or median later stage round has seen a significant reduction in dilution in today’s market. In 2010, the median later stage pre-money represented 55% of the resulting post-financing valuation; in 2015, that number has risen to 75%, a very material improvement in ownership for earlier shareholders. Interestingly, top quartile later stage deals haven’t seen the same change in dilution – in part because today those companies sell a similar percentage of their shares (~25%) but for increasingly large amounts of capital. The typical “top quartile” deal raised $45M in 2015 versus $29M in 2010.
A strong “top quartile” company should be able to raise significant amount either privately in a late stage round or in an IPO by selling ~25% stake in the company to its new investors.
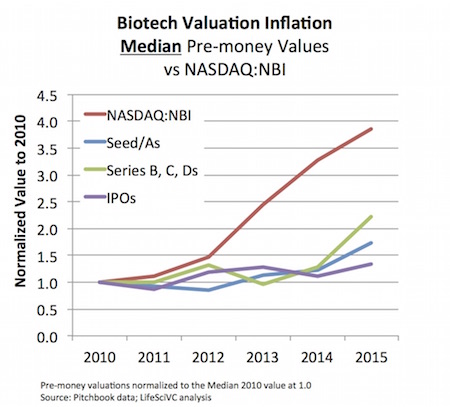
Inflation of private valuations and IPOs over past five years is nothing in comparison to the NASDAQ index.
To understand whether these changes in valuation reflect a disconnect with the broader markets, the median valuations for these three different biotech stages were compared to the NASDAQ Biotech Index (NBI), all normalized to 2010. As is quite evident from the chart, private and IPO pre-money valuation changes have been dwarfed by the overall momentum in the public biotech markets.
Valuations in private and public biotech stocks are clearly related, but their concordance over time, and impact of one on the other, are important and hard to discern variables in the financing and growth of emerging biotech companies.
This is far too linear to be entirely valid, but in general it’s fair to say that attractive public biotech markets which began in 2010-2012 led to an initial acceleration of interest in biotech IPOs in 2013-2014, which has further reinforced valuations in later stage private rounds in 2014-2015 and extended some of the exuberance to early stage rounds. All the while the public biotech markets have continued to be strong, enabling the momentum behind these trends to continue if not accelererate.
This could all unwind with dramatic public market declines, but it’s anyone’s guess as to what a new biotech investing equilibrium could look like in the future. In any case, it’s certainly been interesting to see the recent ripple effects through the ecosystem over the past few years.