After five very strong years, biotech as a sector has struggled to catalyze positive investor sentiment so far for the past twelve months. In a disastrous start to the year, the NASDAQ Biotech Index shed 30% in just the first forty days. The carnage of this winter’s market was captured in a Feb 2016 post. Since then, the stock market has bounced around considerably, amplified by macro volatility with #Brexit, security, and other issues, but closed the first-half of 2016 largely sideways since March.
Against this backdrop, overall biotech sentiment is resoundingly negative on IPOs. Analysts, investors, and pundits alike all complain the IPO market is “horrible” and companies are “limping” out with weak offerings. So how bad is it?
Well, surprisingly, it’s not bad at all on at least two important metrics – the number of IPOs and their pre-money valuations. Context is everything.
According to the National Venture Capital Association (NVCA), there’ve been fourteen VC-backed biotech IPOs (and there are a few more non-VC-backed biotech IPOs too). When you compare that VC-backed number to annual NVCA metrics across over two decades of IPO history, we’re tracking to be on the cusp of a top quartile vintage in terms of IPO activity in 2016. Even more specifically, only five first-half periods in the last 22 years have seen more IPO activity. The second quarter had nine offerings – on average one every 10 days. By any historic measure, this has been a very prolific year for IPOs, and this period would certainly be considered a fully “open” IPO window.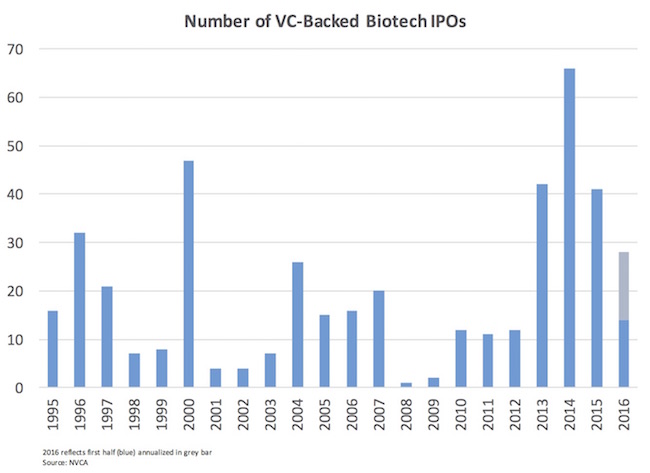
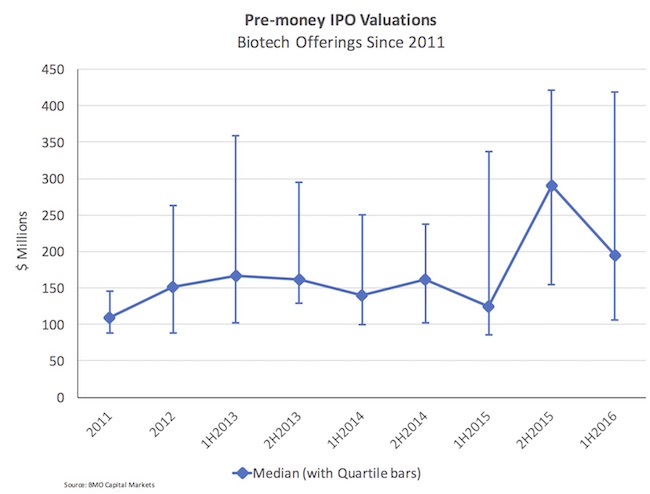
Beyond just being active, an even bigger surprise is that the valuations of the offerings have been amazingly strong. Annette Grimaldi and her colleagues at BMO Capital Markets kindly shared the pre-money valuations of all the biotech IPOs since 2011. As shown below, this year’s median pre-money IPO valuation is 30% higher than it was during the “booming” 2013-2014 period, when close to 100 biotech companies went public ($194M vs $148M). Valuations were only higher at the median in 2H2015, also surprising given how supposedly “challenged” the IPO markets were after September.
It’s also interesting to note the stage inversion. Early stage IPOs have had warm receptions this year relative to their Phase 3/commercial counterparts. The median pre-money valuations of the 11 companies with pre-Proof-of-Concept (Phase 2a or earlier) programs was $244M. The average is skewed even higher ($290M) because of offerings like Intellia, Editas, and Beigene. Innovative younger companies, with their promise and deal potential, have captured more interest from buyside investors.
Those are the “positive” metrics – clearly different than sentiment would suggest.
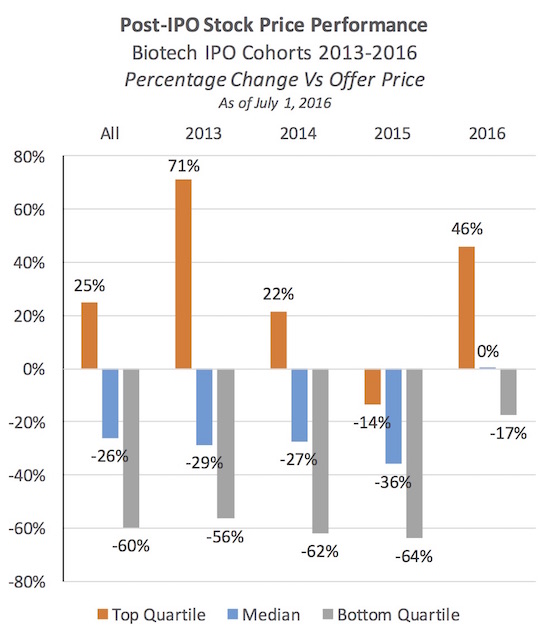
But there are some rather bleak post-IPO performance figures. With the NASDAQ Biotech Index off almost 30% since its peak a year ago, it’s been a hard market to perform well in, even with stellar data. Here are three key pieces of data around performance for the recent four-year IPO window, by annual cohort.
First, at the median, post-IPO performance has been very poor since their offerings, as most observers would expect. All cohorts are negative at the median as of July 1, 2016. That said, top quartile performers – typically the ones with very solid data (here) – have done quite well in the market. Many of these top performing companies are massively off their peak values but still remain significantly above their IPO offer prices (e.g., bluebird bio is off 75% from its peak, but still 250% above its IPO price; Juno and Portola are both off ~50% from their peaks, but are ~50% above their IPO prices).
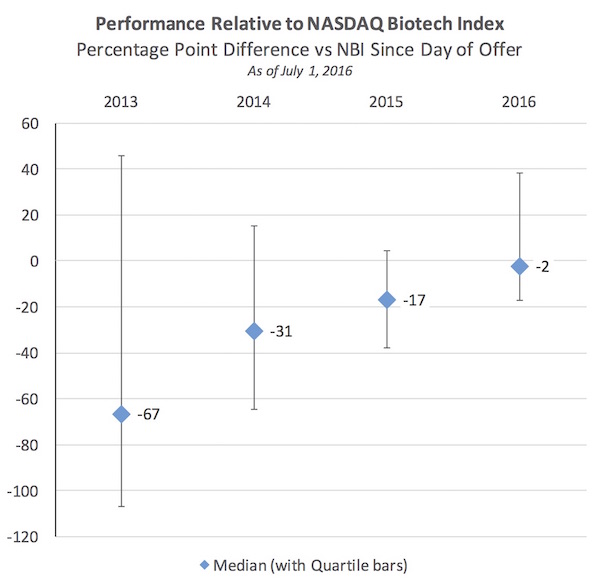
Second, in line with the absolute return data above, relative performance has also been poor: by comparing the relative stock appreciation (or depreciation) versus the NASDAQ Biotech Index’s price on the day of a company’s respective IPO, one can examine the relative performance of a stock to the biotech market as a whole. A zero on this chart would mean the stock on July 1, 2016 was identical to the Index’ performance over the period since its IPO. The bars represent quartiles, so 25% of the companies are above the top of each error bar.
A few observations on this chart: (a) dispersion of performance is largest (as you would expect) the greater the time period, e.g., 2013 has a wider range of performance relative to the Index versus 2015-2016; (b) although the median has underperformed significantly, the top quartile of all these annual cohorts has outperformed the Index, especially for those in 2013; and (c) 2016 IPOs have, to date, performed well against the Index overall.
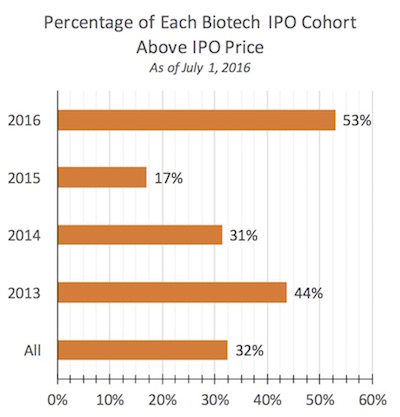
Third, just looking at an IPO price threshold analysis of the data, a strikingly large percentage of 2015’s IPOs are underwater relative to their initial offering: 83% are below their IPO price. Earlier cohorts (2013-2014) are in line with historic numbers where nearly two-thirds or so of the IPO classes in the 2000s were below their IPO price a few years later. For example, of the 77 biotech IPOs in the 2003-2008 period, as of June 2009 near the bottom of the market, 79% were below their IPO price (Figure 2b of this paper). At the market’s peak in October 2007, 59% were below their IPO price.
All these charts reinforce the fact that biotech is an investment class – like most sectors – where the Pareto Principle is in full effect: the top quartile performers drive the vast majority of both the absolute and relative returns. In bull markets this dispersion of returns is harder to distill as a rising tide lifts many boats, but in more challenging and volatile markets the outperformance of the winners becomes quite apparent. And real data begins to trump hype over time (though not always).
Two final thoughts of the IPO markets today.
Strong syndicates of investors are required in these tough markets. Even though on a historical basis the IPO numbers and their pricings have been very respectable, getting companies public today requires strong syndicates and significant insider participation.
According to data shared by Jamie Streator at Cowen & Company, 2016 IPOs have, at the median, had at least 50% of their IPO offerings bought by insiders. This is up from 31% in the second half of 2015. Insider participation has historically been a defining characteristic of IPOs in biotech over the past 10+ years (here), but in the headier days of 2013-2015 it became less of a requirement (here). In some ways, the strong IPOs of 2016 are the residual effect of strong crossover rounds in 2015 (these companies had public investors in their private cap table heading into the IPO); it will be interesting to see how 2017’s IPOs deliver given the tightening of the crossover funding world that has been happening in 2016.
In light of the markets, and in particular the volatility, we’ve also seen a number of public IPO plans withdrawn or postponed this spring (e.g., Viamet, Bavarian Nordic, Apelis, PLx, Basilea).
Compelling companies will continue to get out and price favorably. This is a bit of a prediction, but short of major negative macro news, I continue to believe that compelling, innovative stories will be able to get public during the rest of 2016. Positive clinical news, like that from Sage Therapeutics this week and ASCO ealier in the summer, will be catalysts for the sector. In the near-term queue for upcoming offerings, we’ve got 8-10 companies like Gemphire (this week), Audentes (next week), Kadmon, Visterra, among others.
Further, as support for strong pricing, M&A in biotech remains strong and provides for the prospect of a future takeout premium (or IPO alternative): multi-billion dollar acquisitions of companies like StemCentryx, Receptos, and Acerta certainly help fuel excitement in the sector.
It’s worth noting, though obvious, that simply getting public isn’t the endgame for a biotech company. IPOs can be important steps in the journey of advancing new medicines, and provide access in good markets to larger pools of capital than the private markets can support. While it’s never easy, and it may seem very “tough” right now for those wrestling with going public, the sector continues to benefit from a historically strong period for innovation in the capital markets.


