


Successful deals in venture capital take on a life of their own, especially the rare massive outlier return. Unfortunately for venture capitalists, Facebooks and Twitters are very rare.
Understanding the nature of “winners” requires a good grounding in what a high performing venture return looks like in practice, and our friends at Correlation Ventures have just shared some fascinating data on this topic from their proprietary database.
They’ve defined winners in two ways: those companies that had at least one venture investor generate a return above a specific multiple, e..g, 5x or 10x, or above a certain and significant amount of net gains back to the fund, e.g., $50M or $100M in capital gains.
Their initial analysis examined the data for the overall venture industry. Of the 7976 exits during the 2003-2013 period, the top decile (821) generated a 5x return or greater. Interesting, only ~6% generated net gains for at least one investor of over $50M, implying that lots of 5x deals were multiples of small amounts of capital (see chart here). The good news is the annual trendline: according to Correlation Ventures, an average of 29 companies per year delivered over 10x multiples for at least one VC, but the figures in 2010, 2011, and 2012 were 40, 35, and 63, respectively. So there’s been a greater frequency of high multiple deals.
In order to get a better handle on the BioPharma statistics, David Coats at Correlation kindly shared those data with me as well. There were 763 BioPharma exits during 2003-2013 in their database, and of those, 80 were above 5x and 27 were above 10x. In terms of absolute cash gains net of their investments, 61 exits delivered above $50M to at least one investor, and 26 delivered above $100M. So slightly more than 2 exits per year delivered $100M or more to at least one of their investors (out of ~60 average exits per year).
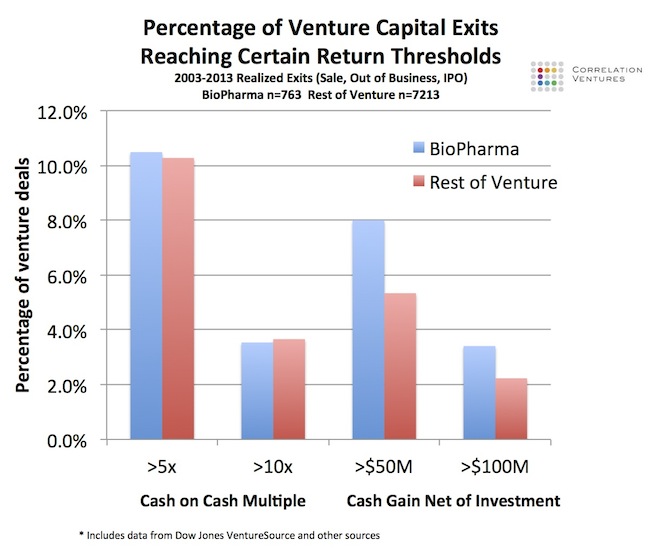
In order to compare these statistics to other venture sectors, I’ve plotted the percentage of deals meeting different thresholds of returns for BioPharma vs the Rest of Venture (all other sectors) in the chart below.
 Two interesting takeaways jump out at me.
First, the percentage of exits hitting both 5x and 10x returns are roughly the same for BioPharma vs other venture sectors. I’m hopeful we can push these numbers up going forward given the challenges of the last decade, but its good to see Correlation’s data support the conclusion that BioPharma (and Life Science) shouldn’t be the “ugly stepchild” of venture (written about here and here). This is obviously not new news to those that read this blog, but validation from another data source.
Second, BioPharma cash returns are more meaningful, more often. More specifically, the overall net cash returns from BioPharma winners more frequently deliver >$50M and >$100M back to at least one investor than other sectors. While the overall percentages of these big exits are low in all of venture, these type of exits occur nearly 50% more frequently in BioPharma than other sectors.
Lastly, I was curious as to whether the 5x and 10x returning deals were the same as those returning $50M or $100M back to their investors. They don’t have to be. 10x on a tiny investment wouldn’t meet the net cash gain thresholds. And a 2x return on a $50M investment wouldn’t ring the multiples. Below is a Venn Diagram that captures the number of exits that deliver a specific multiple (5x or 10x) alone, a large cash gain (>$50M or >$100M) alone, or both.
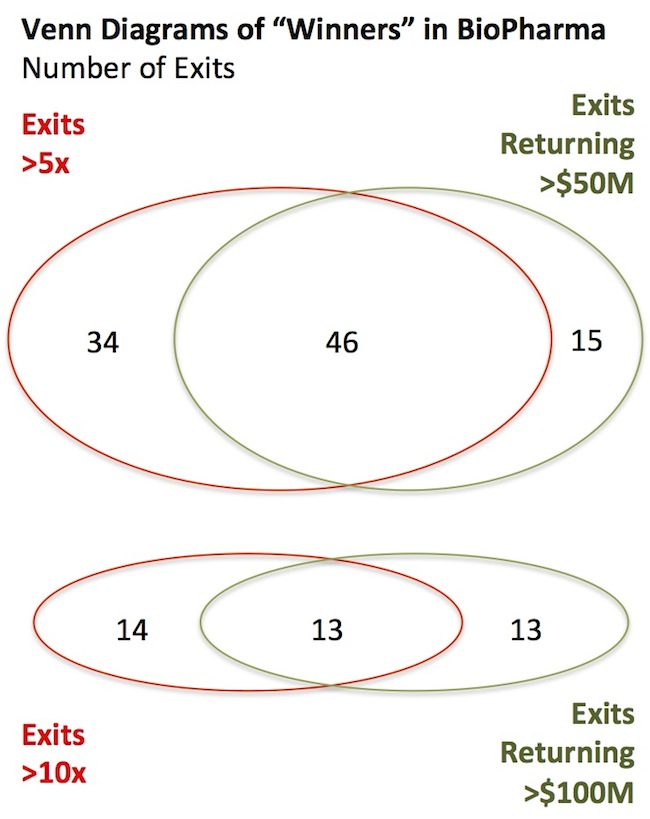
As you might expect, many deals do both – high multiples and high cash gains. But a reasonable number of deals don’t deliver on both. For instance, ~40% of 5x+ deals (34) did not deliver $50M in returns back to at least one investor. Those were all clearly small or modest-sized investments in great deals.
Thanks to Correlation Ventures for providing these data; in order for venture investors, entrepreneurs, and Limited Partners to have realistic expectations around the asset class, an understanding of the historic return distributions – and how we are working to improve them – is essential.