The biotech IPO bonanza appears to be continuing into 2014, with over thirteen offerings already this year. We’re just now completing the busiest two week period in biotech IPOs ever. Another dozen or so companies appear likely to price IPOs over the next few months (here, here). The excitement continues.
Associated with this excitement is a widely held belief that these IPOs are generating significant returns for the biotech venture world, and in a good number of cases that’s certainly true. But, unfortunately, comprehensive data on returns is very difficult to come by. It’s a pain to compile and evaluate the data in S-1’s to fully understand the real returns underlying these offerings.
But one simple measure is to look at the “dilution” section of the S-1, and identify the “average price per share” of the existing pre-IPO shareholders. This measure incorporates all the prices paid privately by venture capitalists and other investors, as well as that paid for the common stock. For companies that have significant common stock holders (>33% would be unusual in venture-backed biotech), this average price per share number will appear lower because of the near zero cost basis of most common stock. For companies that raised money at big differences in valuation, either via step-up rounds or by recapitalizations, this average price per share number can be misleading. Importantly, because of these various contributing elements, it’s not a precise measure of returns for the VCs in the deal. The actual returns for any VC depend on which round they invested in and their own weighted average price per share. But I’d argue that in most cases this metric is a reasonable proxy for assessing a range of outcomes: big win vs modest one vs money loser.
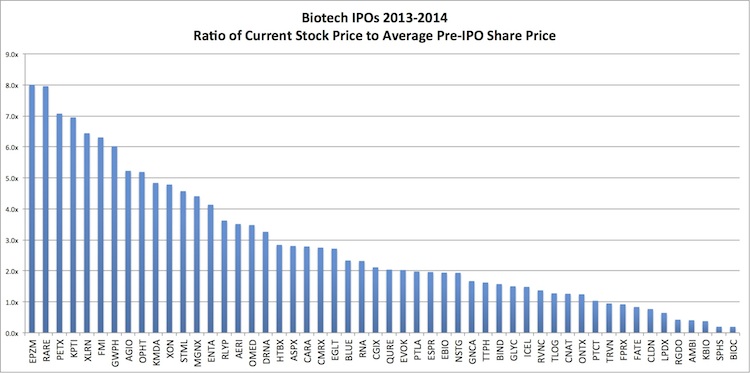
Here’s a chart capturing the ratio of current stock price vs this average pre-IPO price per share for most of the last 12 months of biotech IPOs*.
 Three things worth highlighting here:
- Big winners are well represented. There are a number of very attractive “Top 10%” returns in this IPO window. Top decile in venture capital has historically been a >5x return across any sector, including tech. These are the 1 in 10 outcomes every VC would love to have, and any LP would love their managers to deliver.
- The spread of outcomes is considerable. There are as many top decile outcomes as there are money-losing investments. There are a good number of companies that got public at valuations that are significant fractions of their total invested capital. These are clearly the laggards whose shareholders hope the public markets will somehow rescue over time.
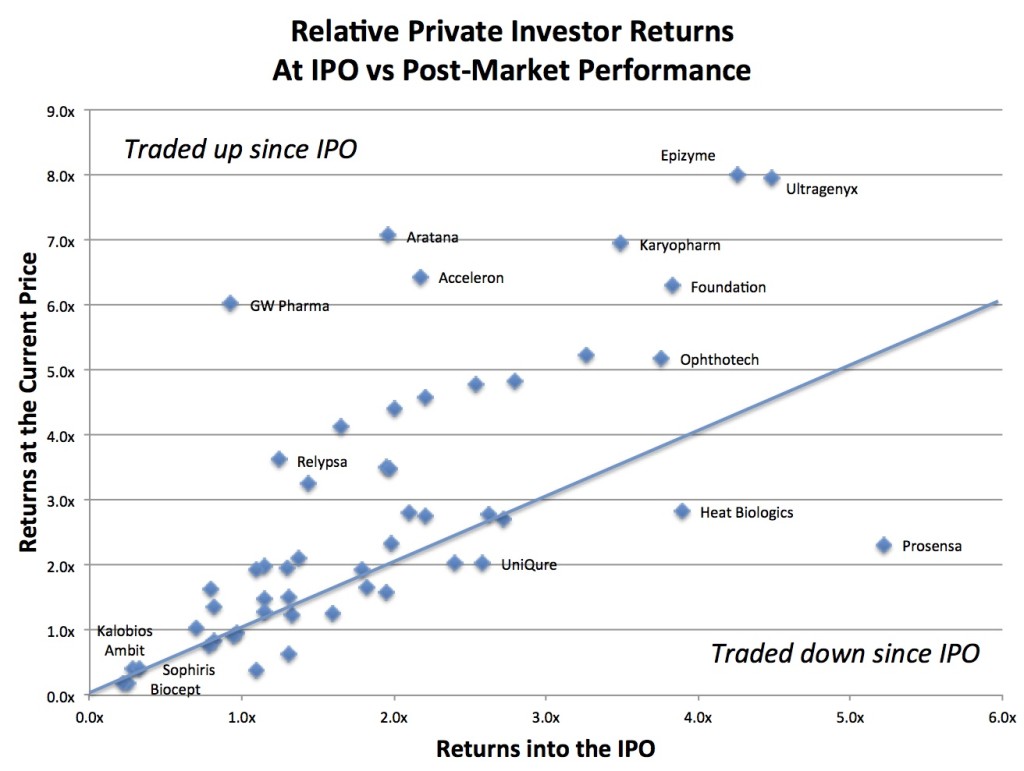
- Post-IPO performance has been a big contributor to returns. The returns into the pricing of most IPOs have been modest – but a majority of the offerings have traded up, a few of them even doubling or tripling since their offerings. This is captured in the chart below. Companies under the equality line are those that have traded down; companies above it have traded up. Its clear to see many of the high flier IPOs have driven the bulk of their “on paper” returns in the after-market. The hope of course is many more biotechs will outperform in future post-IPO trading.
To reiterate the caveat above, the use of the average pre-IPO price per share of the existing shareholders is a good but not perfect proxy for estimating current VC returns. The metric also doesn’t yield any useful data on individual VCs returns, but instead provides an insight into the aggregate weighted average investor return. Of course, I’m reminded of how meaningless averages can be: you can still drown in a river that is an average of six inches deep. But with those caveats, I still think its directionally interesting. To further exemplify the analysis, here are three mini-case studies – the great, the good, and the not-so good:
- Agios Pharmaceuticals (NASDAQ:AGIO). The cancer metabolism company’s average pre-IPO price per share was $5.52, according to their S1. That’s because although the Series A was done at $2.75/share, the pre-IPO Series C price was at a very healthy step-up in value at $13.50/share. The price per share of the founders stock in the company was also close to zero basis. These all contributed to bring the average pre-IPO price per share to ~$5.50. In fact, our friends at TRV received significant founder or sweat equity stock for its heavy lifting early on, as they should, so have a weighted average price per share around $3.00, from what I’ve gleaned off the S1. At today’s price of $28/share, that’s a solid 8x+ return. Other companies like Epizyme (NASDAQ:EPZM), Ultragenyx (NASDAQ:RARE), Aratana (NASDAQ:PETX), Karyopharm (NASDAQ:KPTI), Acceleron (NASDAQ:XLRN), and Foundation Medicine (NASDAQ:FMI) all fit into this category: solid (at least on paper today) returns by all private investors.
- Portola Pharmaceuticals (NASDAQ:PTLA). This biotech juggernaut is one of the few doing expensive late phase development work on its own nickel. Of the nearly $300M they raised privately to finance their big programs, $208M of that came in at a price of $14.10/share across several rounds from 2005-2012. The average pre-IPO price per share was $12.58, according to their S-1. The lower average price is due to the Series A at $10.00/share and the near zero basis of the common stock. At ~$25/share today, the average private investor is sitting close to 2x on their position today. Portola is one of the “premium” biotech stories in the IPO class, having broken the $1B market capitalization threshold; while the market cap is certainly inspiring, its disappointing that it’s venture investors are sitting only around ~2x on such a great story. Reality is that big Phase 3 studies are expensive.
- Ambit Biosciences (NASDAQ:AMBI). This oncology company has a long and weary history. The last private round, a Series E, was ~$7.60/share. All prior rounds had been recapitalized, so prior share holders had much higher effective share prices. The average pre-IPO price per share $24.62, according to the S-1. At the current price of ~$10.00, the IPO buyers are up 20% (since the offering was at $8.00/share) and the Series E investors (if they didn’t invest previously) are also up >20%. But most Ambit private investors were underwater at the IPO and remain significantly so. This challenging theme holds true for Regado (NASDAQ:RGDO), Sophiris (NASDQ:SPHS), and Biocept (NASDAQ:BIOC), among others.
So reflecting on all the recent IPOs, there are clearly some with great returns – the ones we can all hope for (and work towards) in our portfolio. There are also a bunch of other massive wins from prior IPO vintages, most notably Intercept (NASDAQ:ICPT) from fall of 2012. And as many of these IPOs become more seasoned in the markets, and generate clinical news flow, there’s a reasonable chance more will trade up into further attractive returns (or the opposite). But for the right story, the public markets can generate superb top decile or better venture returns.
With a window as wide open as this, and my M&A post from last week provoking some readers, I was asked why would one ever sell their company in this market rather than take it public. The answer is simple: IPOs aren’t an indicator of or a future guarantee for good returns. In certain cases, they’ve been massive wins. In an equal number of others, they’ve been big time losses. The reality is that M&A can offer a very credible path to top decile, >5x returns (e.g., Aragon, Avila, Plexxikon) and often with more certainty than the volatile public equity markets. Many of the laggards on the IPO chart above are stories that couldn’t get sold privately so went the route of the IPO because the window opened – they had bloated capitalization structures and there was little appetite to fund them further privately.
The sector clearly benefits from having a dual track exit environment: a healthy IPO window and a bustling M&A market. The debate in board rooms about whether to go public or to be acquired involves a complex set of considerations: likelihood of M&A or an offering, the valuations of both paths, future dilution, certainly of returns now vs later, etc… Every company makes its own calculus around those issues. But there is no one sized fits all approach to building great companies and achieving solid returns.
* Note: Receptos, Xencor, and Insys S-1’s did not disclose the average price per share of existing stock.


