


Return distributions in venture capital across different sectors have been a frequent source of commentary, and new data from Correlation Ventures provides further substrate for that theme.
I’ve highlighted data from Correlation Ventures (CV) in the past, looking at top decile returns (here), returns by multiple or aggregate size (here), and their comparison to the S&P500 (here). The team at CV has built an extensive data set, as a key part of their investment model, compiled via datasets like Dow Jones VentureSource.
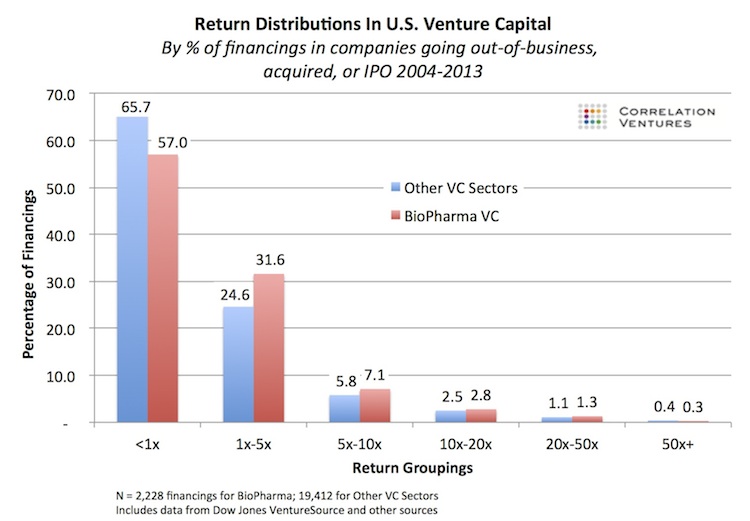
CV just released a new dataset looking at 21,640 financings of U.S. VC-backed companies that closed between 2004-2013 into companies that have been acquired, IPO’d, or went out of business. Approximately 10% of these financings were into BioPharma companies; this proportion is less than the share of dollars flowing into biotech over the decade (>15%) and likely reflects the multi-year tranched “financings” in biotech vs other sectors. The bulk of the other financings were in technology-related sectors like software, information technology, eCommerce, etc… It’s important to emphasize these are financings, not companies, and so the returns for one series of financing could be positive while for other financings negative. Kudos to Correlation for pulling this analysis together.
The distribution of returns in these financings is intriguing, and continues to support the thesis that BioPharma venture investing, in contrast to common perception, has actually outperformed most other non-biotech venture sectors at most of the percentiles of performance. Here’s the summary data:
Key observations:
- The rate of “significant winners” above 5x is greater for BioPharma financings than other sectors. Based on more than 20K aggregate financings, the rate was 11.5% for BioPharma vs 9.8% for other sectors; given the huge size of the dataset, this is likely to be real difference – a 17% spread – though I have not run statistical significance analyses on these numbers (I only have the summary data). Further, this favorable margin for BioPharma financings themselves is consistent with prior analyses at the company (rather than financing) level (here), showing a higher rate of 5x+ outcomes in BioPharma.
- Frequency of returns above 20x are surprisingly similar across BioPharma and other sectors. With frequency rates of 1.6% in BioPharma and 1.5% in other sectors, these data suggest that 1-out-of-60 financings lead to greater than 20x returns. This makes intuitive sense if one considers the pricing of early “seed” rounds of financing and the eventual returns of winners off of those values. In the past I have speculated that the distribution curves likely favored non-biotech sectors at return rates this high, but CV’s dataset suggests otherwise. Only above 50x does BioPharma begin to numerically lag other venture sectors, where only 1-out-of-300 financings reach those return levels. But the numbers begin to get very small and noisy: only 7 financings led to >50x returns in this BioPharma dataset over the decade.
- Loss rates for BioPharma financings are lower than the rest of venture capital. These data show that 57% of BioPharma financings returned less than their invested capital (<1x) versus 66% of financings in other venture sectors. This is inline with prior analysis showing more favorable loss ratios in biotech (here, here), both on a company/deal basis (% of deals that lose money) and on capital-weighted basis (% of dollars invested into loss-making deals). The latter figures – dollar-weighted – are even more favorable towards biotech (e.g., Adams Street Partners data had a 36% loss ratio for biotech, vs Internet at 59%.).
These data are further confirmation of the relative attractiveness of biotech venture capital in the asset class. Further, a recent report from Jon Norris at Silicon Valley Bank highlights the resurgence in returns in healthcare with over $12.5B in potential LP distributions in 2013 alone (3x higher than most years in the past decade; see Exhibit 12 in this link to the report). This is solidly 2.5x more than the amount invested into new BioPharma deals on an annual basis. Estimated distributions have outpaced investments in BioPharma for the past few years.
Given the nature of these return distributions, it’s worth pausing to consider why it is that biotech has historically been perceived as the “ugly stepchild” of the asset class (written about here and here). We’ve speculated about the lack of halo deals (Facebook’s), the unrealized valuation problem of emerging biotechs (here), and the issue of biotech’s esoteric R&D models (vs simple-to-digest social media stories). But on top of these, one big driver may just be the challenge of absolute vs relative numbers. The reality is Tech represents 80%+ of the financings over the last decade – some 18,000 financing events. At a 20x “hit rate” of 1.5%, that’s nearly 290 financings outside of BioPharma vs only 36 from the sector. That’s 8x more noise, the sort of stuff that fills up TechCrunch, Primack’s columns, Xconomy, and even broader media (NYTimes etc). Beyond the
With 2013-2014 continuing with strong M&A and IPO momentum, coupled with continued demand for innovation from Big Pharma/Big Biotech, returns and LP perception of the sector have strengthened and are likely to continue to improve; its not surprising that a number of Life Science focused venture firms are raising new funds in this environment.
Thanks again to Correlation Ventures for sharing the above analysis – shining more light on the opaque realm of venture capital data.