


Figuring out what disease areas are attracting the most venture funding and deal-related capital in startup and emerging biotech has historically been quite challenging as few if any datasets track it comprehensively. But late last week, on the eve of BIO, a significant piece of analysis should shine some light on the topic.
David Thomas and Chad Wessel of BIO take a very data-rich crack at addressing this in their new June 2015 report titled “Emerging Therapeutic Company Investment and Deal Trends”. It covers much of the ground of their prior venture-funding report from February 2015 (here), and extends it with more analytics around deal-making and public market financing (IPOs, Follow-Ons). For those data-junkies interested in the specifics, it’s well worth reading.
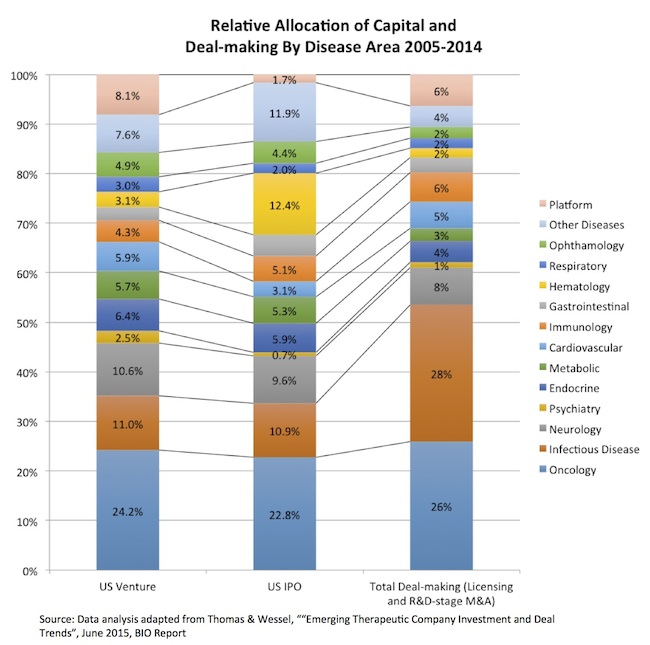
While there are many nuggets in the report, I wanted to highlight one interesting angle in the data: the relative allocation of capital across disease areas over the ten-year period of 2005-2014 between the venture-backed private therapeutic biotech space and two downstream markets, namely IPO funding flows and BD deals (licensing and R&D-stage M&A).
For background, over $38 billion was deployed by venture capital into therapeutic biotech companies over the ten-year period in nearly 3000 financings. During that time, there were 173 therapeutic biotech IPOs raising over $13 billion (most of which were in the last two years), and over 1500 BD-transactions reflecting over $110 billion in upfronts and milestones spread across licensing deals and R&D-stage M&A. So it’s a fairly extensive dataset.
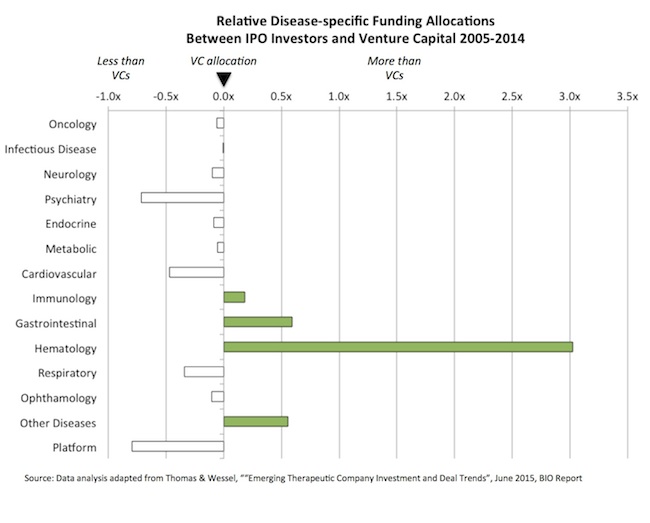
Comparing these three markets gives an interesting decadal view of where funding has gone and what areas have attracted the most attention. The three charts below capture the allocation across different areas (top chart), as well as the relative over/under-allocation versus where venture funding has gone (e.g., IPOs vs venture and deal-making vs venture in the bottom two charts).

 A few observations:
- Oncology is remarkably steady at roughly 25% of the fund flows across all three markets. I’m sure there are some changes within oncology: for example, targeted kinase inhibitors were probably well represented in the earlier years of the dataset (2005-2009) vs more recently the burst of I/O and engineered cell therapy funding.
- Hematology (outside of oncology) appears to have been funded much more significantly on a relative basis (12% vs 3%) by IPO investors than the venture community. This includes disease areas like “Blood Stimulators, Coagulation agents, Anemia, Antithrombotic, Chronic Venous Ulcers, Peripheral Arterial Disease (PAD), Sickle Cell Disease, Iron Overload, Hemophilia, and Neutropenia/ Leukopenia”. About 6% of the IPOs over the last decade were in this category. VCs, relative to IPO investors, appear to have under-invested in this area over the decade.
- Infectious Diseases stands out as a significant deal-making area, even topping oncology over the past decade. Capital from BD transactions on a relative basis far outstripped the venture and IPO markets in infectious disease (28% vs ~11% of funding). These data suggest that at least when it comes to investing in areas with significant deal interest, venture capital has been under-allocated to infectious diseases over the decade.
- Platform companies, as one would expect, were predominantly funded by the venture community vs public investors. By the time these deals get to their IPOs, they’ve established their lead program and the report would classify them as such.
There are obviously many caveats to this analysis, and the methodology section of their report goes through some of these limitations. Fundamentally, the merits of the above data rely on the right classification of companies, which is often quite difficult if the lead program can go in different directions (immunology or oncology, cardiovascular or metabolism, etc…). But in general, it’s an interesting report with a broad range of observations.
Thanks to the analytical team at BIO for sharing these data; have a good #BIO2015!