


By Haojing Rong and Aimee Raleigh, as part of the From The Trenches feature of LifeSciVC
This blog post is the second in a series on key diligence concepts and questions. If you missed the intro blog post yesterday, click here.
For this deeper look at pharmacology, we will be focusing on a theoretical small molecule inhibitor and building out the different “clues” to look for as you pull together a PK/PD/efficacy relationship thesis. That said, this post is only scratching the surface of a very expansive space – for those interested in learning more, we link to a handful of resources that may be helpful. I am delighted to turn it over to Haojing Rong, SVP Translational Science at an Atlas Venture newco and a talented DMPK scientist and leader with an impressive career (former Kymera, Shire, Pfizer, Merck, Amgen, among others). Given her qualifications, she has graciously agreed to co-author this post and share her perspectives. Without further ado, let’s dive in!
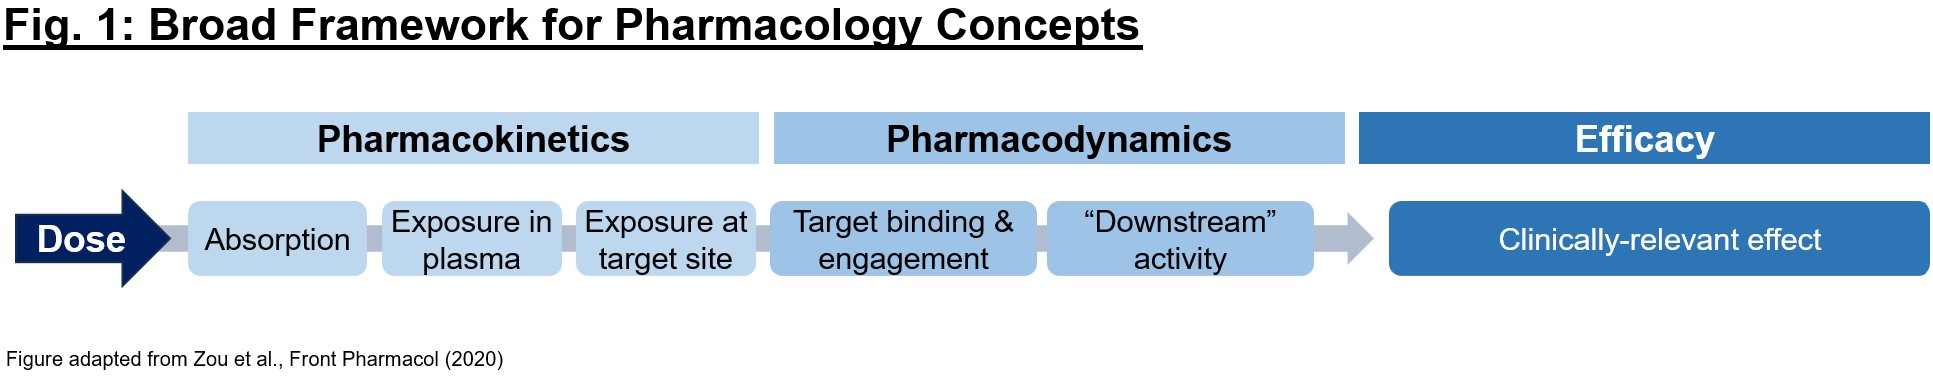
What is pharmacology, and why is it just as important as biology for understanding a drug’s activity? Often times, picking the right mechanism with which to address a (potentially dysfunctional) target in disease is only the first step in developing a therapeutic. To achieve the desired biology, we must have conviction that it (1) gets to the desired target with sufficient exposures over a certain period of time (pharmacokinetics/PK readout), (2) interacts with the target in the desired fashion, enacting proximal and distal “downstream” biology (pharmacodynamics/PD readout), and (3) exhibits pharmacological effect that impacts the disease in a way to alter the clinical course (efficacy readout). Each of these 3 readouts can be considered as a critical piece of a puzzle – evidence of one piece alone (e.g., efficacy in an animal model) is not sufficient on its own to justify moving a program into the clinic, and a preclinical development team’s mission is in large part to determine if the puzzle pieces fit together in a compelling story (Fig. 1).
Given the above 3 pieces of the broader pharmacology puzzle to solve, what does a comprehensive dataset look like? Below we will outline the steps to develop a PK/PD/efficacy relationship. As an example throughout this piece, we will use a small molecule inhibitor against target X for simplicity, though of course these concepts can be applied more broadly.
Pharmacokinetics (PK): Before the drug does anything to the body (term PD), the body does a number of things to the drug (term PK). These are Absorption, Distribution, Metabolism and Elimination, also known as ADME. These processes determine the fate of the drug (PK) in plasma and tissues throughout the body. The first piece of the puzzle is to determine whether our small molecule gets to the site of interest (target) at high enough concentrations to achieve a desired activity. In order to do that, upon administration the small molecule must be absorbed, may need to survive metabolism in the liver as first path, reach systemic circulation, and distribute to the tissue of interest (among others) throughout the body. Note that here we refer to exposures vs. dose – even if dose is held constant, exposures will vary by species and across compounds. For each compound, exposure at the site of action along with its potency should be considered when interpreting the PD effect.
Just as in real estate, PK is all about “timing” and “location”. The PK of our theoretical small molecule inhibitor will be a time-concentration (exposure) profile and will vary depending on route of administration (IV vs. PO vs. SC, etc.). Many important metrics, e.g., Cmax, Cmin, T1/2, etc. can be derived from the PK profile to represent exposure at a given time and how quickly it changes. That’s the “time” piece; what about “location”? That refers to tissues, which is the site of action for most drugs. Properties of the molecule, such as lipophilicity, basicity, whether it is a substrate of cell membrane transporters, etc. often result in different exposures in tissues vs. plasma. Nevertheless, plasma PK is the most useful parameter when comes to understanding in vivo PK/PD relationship. Therefore tissue-to-plasma partition ratio, Kp, is a very useful parameter to bridge the most accessible PK (plasma) to the most relevant PK (target tissue).
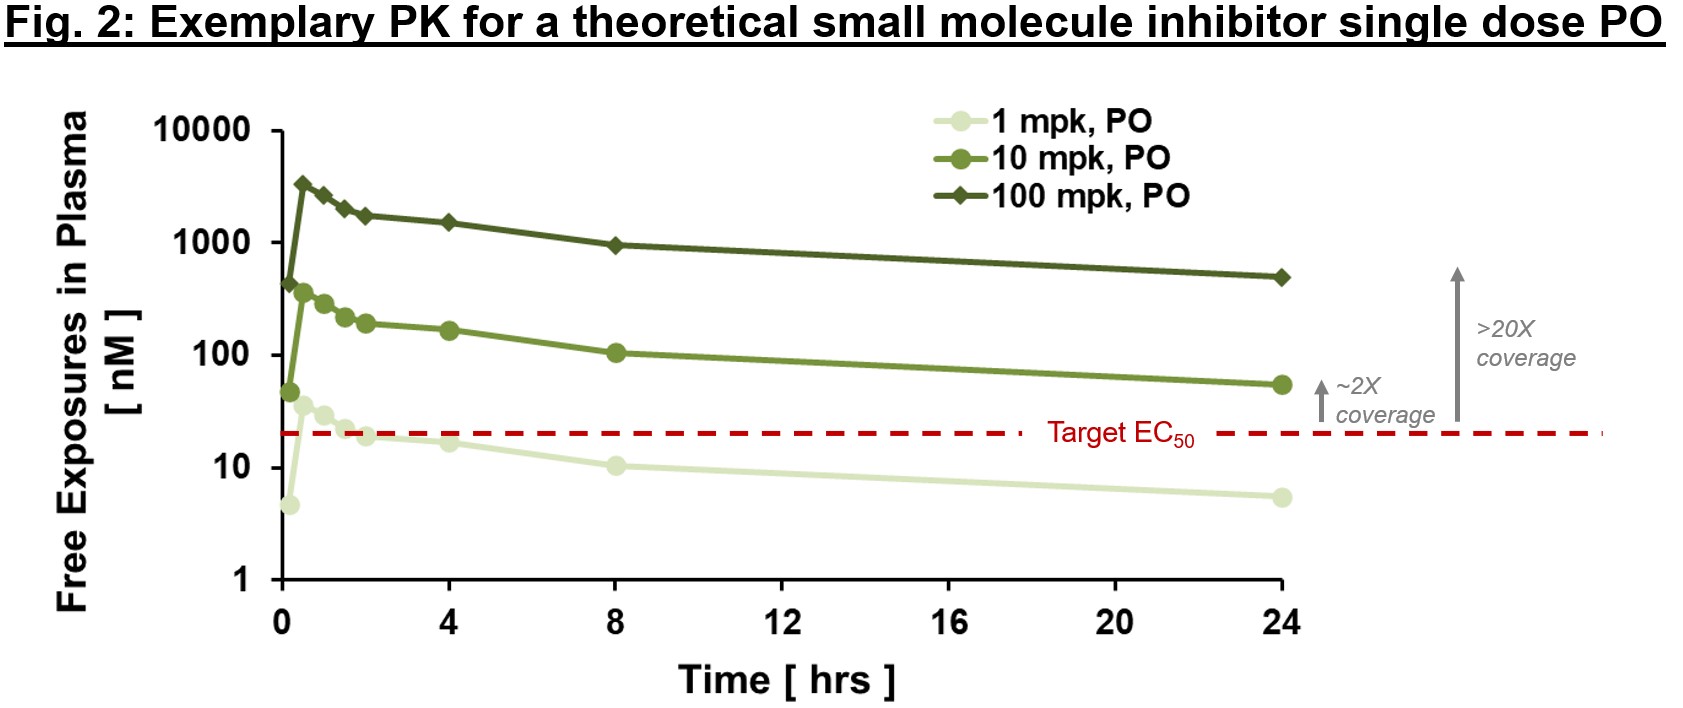
Often it is important to distinguish between “total” and “free” exposures, with the latter referring to the fraction of the small molecule that is not protein-bound and thus is “free” to interact with the target. An important metric we often use to ascertain whether exposures are sufficient to exert downstream PD and efficacy is “multiples over EC50, EC90″”, etc. where EC50 is the compound’s half-maximal effective concentration. As in Fig. 2, free exposures plotted over EC50 (derived from an in vitro potency assay) can help directionally inform whether any “effect” you are seeing in vivo is on-mechanism. With the assumption of dose-proportional PK, one could ask the question of “what dose will provide 2x vs. 20x EC50 coverage at Cmin?” (Fig. 2). We expound below, but ideally PD and efficacy improvements are commensurate with differences in exposure multiples above EC50 (at least up to a certain point). If so, relatively early on in drug development we can generate a thesis regarding target coverage required to enact a desired effect. Of course, this is one framework for evaluating potential effect of PK on PD or efficacy – there are instances where EC50 may not be sufficient. Higher multiples indicate greater target coverage (e.g., EC90 or higher) is needed for PD or efficacy. Although very basic, this framework is a powerful diagnostic tool (think of this as your annual physical). If PK and potency multiples line up with PD and efficacy, a big congratulations to the project team! Not only can one have reasonable confidence in the thesis of this MoA, but also this indicates good IVIVc (in vitro–in vivo correlation). IVIVc is the foundation of structure-activity relationship (SAR) for lead optimization, which is a process to further improve an active compound to a safe and efficacious development candidate.
When solving the first piece of the PK puzzle, remember “time” and “location (tissue of interest)”, use Kp (tissue to plasma partition ratio) to bridge plasma and tissue PK, bring out the potency measurement EC50, and line all of them up for comparison. Once put together, these very basic information are surprisingly informative – an “aha” moment from these relationships will give you greater confidence in the validity of the mechanism and path forward for obtaining a development candidate for clinical testing. Conversely a “what’s going on?” reaction is often the beginning of a deepened understanding of the biology and pathway. Expect the “unexpected” is part of new ideation experience. Turning “unexpected” into “expected” is what brings all of us together on the journey of discovering new medicines.
Pharmacodynamics (PD): Once there’s a good handle on the PK understanding, we look for “downstream” PD readouts reflecting proximal target engagement and/or distal pharmacological activity resulting from the drug’s effect on the target. Ideally multiple PD effects can be leveraged; some may be noisier than others, so best to start out with a few PD readout options and narrow down to those most relevant or consistent. It is essential early in the drug discovery process to identify PD readouts that can ideally be used across both early in vitro potency readouts all the way to in vivo studies in animals and humans. While not always feasible, biomarkers that can be used across assays and model systems can greatly enhance the ability to generate IVIVc datasets to prove or disprove the PK/PD/efficacy relationship. Leqvio (inclisiran, siRNA targeting PCSK9) offers a great example of PD markers, with target engagement represented by decreased PCSK9 transcript and slightly more distal PD represented by decreased LDL cholesterol. LDL-c is a circulating marker that can be measured accurately and with relative ease (and over both acute and chronic time courses) in mouse and nonhuman primate models, and is straightforward to evaluate in serum samples in the clinic for both healthy volunteers and hypercholesterolemia patients. Other examples of well-supported PD readouts include circulating IgG for FcRn antagonists, pAKT for PI3K inhibitors, and serum tryptase for mast cell depletion strategies.
Circling back to our exposure plot (Fig. 2), PD markers are expected to change with exposure – for example, at 1x vs. 3x vs. 10x multiples above EC50/IC50, one would expect progressively increased PD effect (up to a certain likely “saturating” exposure). If a PD readout is not exposure-related (flat response or even inverse response), that may be a sign to re-evaluate the mechanistic hypothesis or the appropriateness of the chosen PD marker. There are many “shades” of PD biomarkers, target engagement biomarkers, proximal or distal PD markers, and efficacy biomarkers. Some can be quantitative while some are merely qualitative. PD biomarkers are more robust for some targets than others – e.g., for many immune-oncology therapeutics there are a number of indirect readouts for immune cell activation that, while not sufficient in isolation, combined can serve as a reasonable PD readout.
It takes a village to choose PD biomarkers and use them to solve the PD puzzle. It starts with couple of simple yet key questions, “what do we expect to learn from this biomarker with our drug?” and followed by “what decision we will make based on this biomarker?” Sounds challenging, and it is! At the same time, biomarkers are the most important tools in drug development to translate biological knowledge to its application in human medicine. PD biomarkers are “the messengers” that inform us “what the drug is doing to the body?” along the pathway, from target interaction to pharmacology and ultimately efficacy. It is our job to understand what the PD biomarker will and will not tell us, and to use it accordingly to guide us on the journey of hypothesis testing. For an early-stage program (particularly with novel biology target) if your PD readout is not correlated with exposures, take a moment to develop an understanding of the disconnect and, if needed, consider alternative readouts.
Efficacy: Ultimately what we care about is often efficacy of a molecule, but efficacy alone is not a substitute for pharmacology. If a compound is efficacious at a single high dose in an animal model, it is impossible to disentangle whether that efficacy derives from on-target or off-target effects (or, often as is the case with small molecules, a combination). The PK and PD readouts discussed above help to set the stage for maximizing potential to achieve efficacy in preclinical models, as well as provide a framework for interpreting efficacy as part of a broader optimization scheme for future molecules. Similar to the PD readouts discussed above, the ideal efficacy parameters in animal models relate closely to primary endpoints that will eventually be used in clinical trials, for example tumor shrinkage, surrogate disease severity scores, levels of circulating markers, weight loss, etc. It is also ideal for the preclinical model to be at least somewhat predictive of human outcomes, though of course this ideal situation won’t apply for indications where no precedent efficacious therapies exist. Unfortunately for some indications, the translation of model systems is a limitation, and while this feature certainly shouldn’t discourage investment in areas of high unmet need but poor model systems, it does shift substantial de-risking inflection points into the clinic.
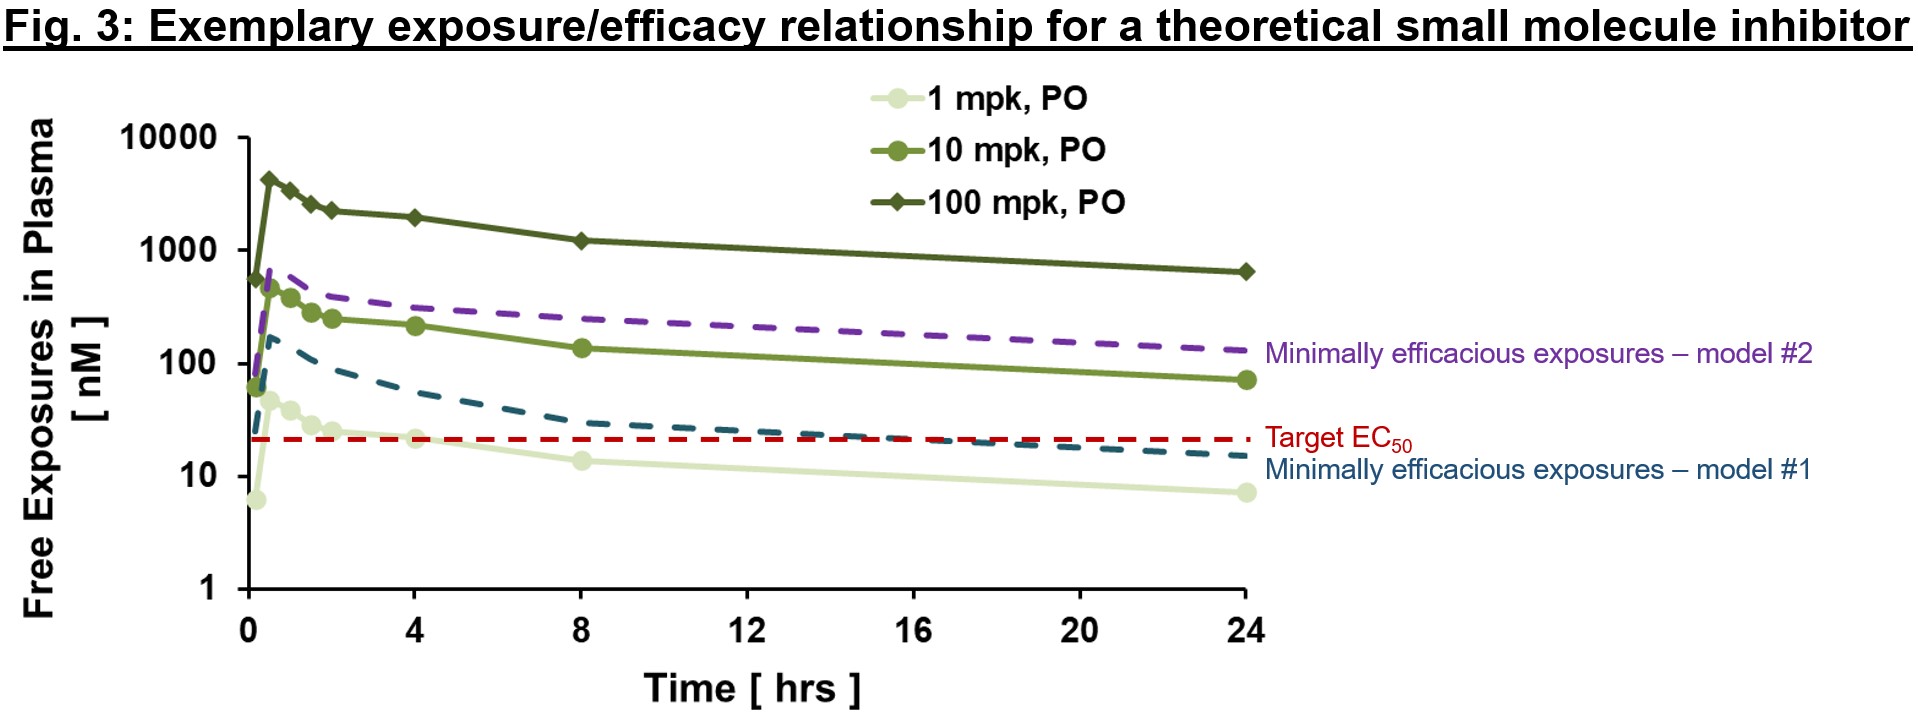
An exemplary exposure/efficacy model is shown in Fig. 3, with exposures shown at steady-state (hence they differ from Fig. 2 above given slight accumulation with time to steady-state values). Here, we might assume that target coverage (exposures ≥EC50) is required for at least 12 hrs a day (based on findings from animal model #1), and to be comprehensive may plan for clinical testing to cover free exposures much higher than EC50 (≥100 nM, minimally efficacious in animal model #2) to test the hypothesis with higher target coverage. Depending on the availability of a validated animal model of human disease, different risk mitigation strategies may be considered. If a translational model exists, the relationship of exposurePD responseefficacy in the model is invaluable to inform exposure required for efficacy and sufficient safety window (also known as therapeutic index, a topic for another day!) for the proof of concept (PoC) clinical trial. In the case that a model does not exist, PD biomarkers are our best bet to ensure that relevant pharmacology will be tested in the clinic. That will allow us to test the clinical PoC of new target, in a hypothesis-driven way.
Keep in mind that we are developing medicine for human disease. All preclinical models, including human/patient-derived cell systems and in vivo animal models, are tools to guide safe and efficient clinical development. When working on novel targets for a disease with complex biology (e.g. Alzheimer’s Disease) that involve multiple pathways depending on the stage and genetic disposition, relevant pharmacology models, whether in vitro or in vivo, are more useful to understand exposure/PD relationship in vivo, which can be used to guide dose and PD biomarker selection for a clinical proof of concept (PoC) study.
Now that we’ve discussed the separate elements of the PK/PD/efficacy relationship, how do these come together in preclinical development? Early in lead optimization, PK and PD are frequently assessed for many compounds from different series, and the early exposure/PD relationship can help (1) support early theses on target coverage required as well as (2) further refine optimization parameters as compounds continue to be synthesized and tested. At the development candidate (DC) nomination stage, at least 1-2 DC contenders should have robust PK/PD/efficacy data packages. Each of the three pieces of the pharmacology “puzzle” described above help to inform how far away we are from the “finish line” of our ideal base-case profile, and in doing so inform whether the preclinical development process may be a marathon or a sprint.
With all this in mind, what are some common pitfalls in establishing PK/PD/efficacy relationships?
- Using dose vs. exposures to compare across species. PK ultimately depends on a myriad of factors (e.g., metabolism, which often varies slightly by species) and thus exposures should always be used to benchmark molecules and to develop early assumptions for human efficacious dose range. Comparing doses across species or across molecules (“our competitor had to dose at 100 mpk to achieve tumor regression and we are only dosing at 50 mpk!”) is less useful given that dose (unlike exposure) cannot be directly compared to potency measures and used to extrapolate target coverage hypotheses.
- Using efficacy as a “surrogate” for the PK/PD/efficacy relationship. Sometimes a unique hit is nominated in a screening assay early on and limited funding is available for extensive chemistry synthesis and testing. Even so, it is essential to test for dose-ranging PK and PD ahead of performing preclinical efficacy experiments. In our experience in evaluating early seed company pitches, it is not uncommon to see a single high dose tested in an animal model to justify the entire thesis, but without knowledge of exposures and biomarkers that discriminate this efficacious dose from one that is not. Without the full data package, it’s usually impossible to determine whether efficacy is on-target (and biologically plausible) and thus carries significant risk in (pre-)clinical testing.
- Testing too few compounds or only close analogues. Often it is helpful to see the PK/PD/efficacy relationship hold over disparate chemical matter, and thus testing compounds diverse in structure from multiple series helps add confidence to the data package. Testing only a single compound (almost unheard of) or close analogous may obscure aspects of the relationship. The more diversity in molecules used to develop and test the pharmacology hypothesis, the better a hypothesis is de-risked before going into human testing.
We hope this article serves as a helpful introduction to some of the datasets and relationships we often look for when evaluating a new target, mechanism, thesis, etc. in a new company setting. This is, of course, a simplified description of a very complex series of topics, and for readers who wish to learn more, please check out the below resources:
- “The Importance of PK-PD.” Barrow and Lindsley, Med. Chem. (2023).
- “Dose Predictions for Drug Design.” Maurer et al., Med. Chem. (2020).
- “Can the flow of medicines be improved? Fundamental pharmacokinetic and pharmacological principles toward improving Phase II survival.” Morgan et al., Drug Discov Today (2012).
- “Application of Pharmacokinetic-Pharmacodynamic Modeling in Drug Delivery: Development and Challenges.” Zou et al, Front Pharmacol (2020).
- “A guide to drug discovery” series from Nature Reviews Drug Discovery (Jan 2023). https://www.nature.com/collections/hkgvrspwtn. A series of articles discuss particular aspects of the process of turning ideas into drugs. Written by those closely involved in the discovery process, these articles aim to provide insights that will aid in future drug discovery programs.