


As everyone in biotech knows, the last eighteen months have been an unprecedented time in the public capital markets. 2014 is on track to become the best year ever for life science IPOs, topping both 2013 and 2000. Last week was the busiest single week – with eight IPOs – since February 2000. Over 120 life science companies have gone public since the beginning of last year.
This staggering volume of deals has brought nearly $10B of public equity financing to emerging life science players, at attractive prices, which serves as much-needed growth capital to advance their pipelines.
Instead of focusing, though, on the topline numbers of offerings and capital raised as a comparison to historic IPO windows, I thought it might be useful to reflect on some of the distributions in the data and a few observations of what has made this market so distinctive.
I’ve narrowed the subset of IPOs to those more relevant to our vantage point at Atlas: the 66 VC-backed biotech therapeutics companies that have gone public since January 2013, using a list from the NVCA for “VC-backed” companies and Cowen data. Today, these 66 companies have a combined market value of $27B. Here are a few observations:
- This cohort of newly-minted public companies is significantly over-weighted for historically “top decile” biotech valuations. As I have written before (here), over the past decade a $400M valuation has been the cutoff for the top decile of M&A and IPO outcomes in VC-backed biotech. Of this recent cohort of IPOs, almost 40% of them currently have valuations above this number as of the end of July. That’s a 4x-higher frequency of “top decile” valuations than the rate in the past decade. This is clearly reflective of the bullish nature of the biotech markets today, but I think it also highlights the value of high impact clinical data. Many of these emerging companies have the “glimmer of greatness” and, with luck and capital, could become the next Alexion or Vertex in a few years. This observation is in some ways an expected and obvious one – the market wouldn’t be perceived as hot and exciting without this – but it’s still impressive how far above the historic norms this window has been.
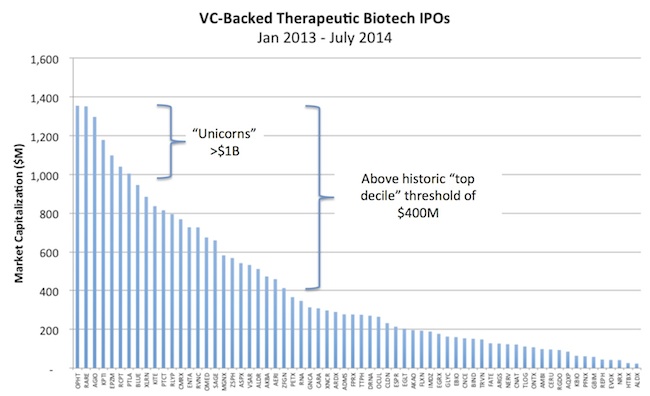
- Biotech is creating “unicorns”. As I count it, ~10% of these venture-backed offerings (7 companies) have gotten above $1B (the “unicorn” valuation) and held their value through the last few months. All of these stocks traded up considerably from their IPO prices, ranging from 67-200% upward movement in their prices. Seeing unicorns with 1 out 10 new IPOs is a very good hit rate; in most sectors, it’s far less common than that.
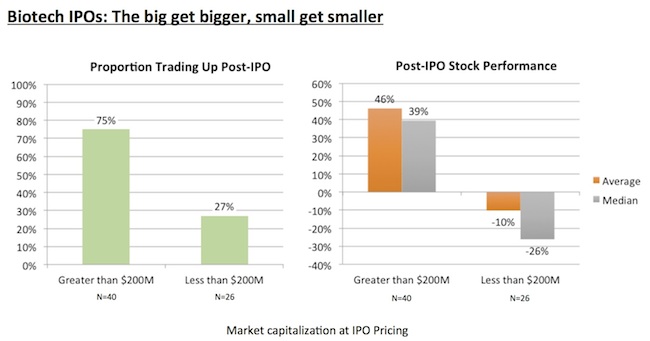
- Virtuous and vicious cycles exist in the market: the big get bigger, the small get smaller. As mentioned above, the “premium” valuations today are a function of both good pricing and stock appreciation. Of the 40 companies with post-offering initial valuations above $200M, ~80% of them have subsequently traded upwards from their IPO price, with average gains of 46%. Conversely, of the 26 companies valued below $200M at their IPOs, 73% of them have subsequently traded downwards, with an average loss of 10%. Interestingly, this measure – with nearly three out of four of these companies trading down from their IPOs – is in line with historic trends (check out Figure 2 of this Nature Biotech article, “Beyond the IPO”) where even at the October 2007 peak, 59% of the past four years of IPOs were below their offering prices; by June 2009, 79% were below. Interesting that in today’s “hot” biotech market, the “micro-cap” IPOs with post-offering valuations south of $200M have all traded lower. The silver lining, of course, for those smaller players is that regardless of how they trade in the near-term, they are now public, can raise capital in different ways, and can benefit from future positive clinical data news flow.


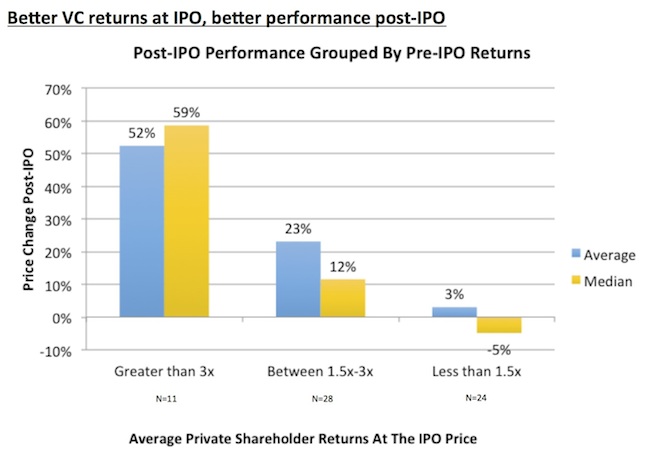
- Higher average private investor returns going into the IPO pricing appear to correlate with stronger after market performance as well. Using the “existing” private shareholder weighted average price per share as a proxy for the typical private investor (as I have in the past, here), companies that got public with higher private “paper” returns into the IPO pricing (>3x) have out-performed since their offerings, up 52% and 59% on average and at the median, respectively. For example, Epizyme and Ultragenyx IPO’s were both priced well above 4x their weighted average private share price, and both have gone on to appreciate by ~100%. At the other end, companies that posted less attractive returns into their IPO pricing (<1.5x, though most of which were <1.0x) have struggled relative to their peers, at 3% and -5% on average and at the median. It shouldn’t come as a surprise that companies hitting on all cylinders privately are continuing to do so in the public markets; another version of the virtuous/vicious cycle at work in this market. Also, it suggests that these private shareholders aren’t trying to “take every dollar off the table” during the IPO pricing, given the post-market performance (many of whom shot up on their first day of trading).

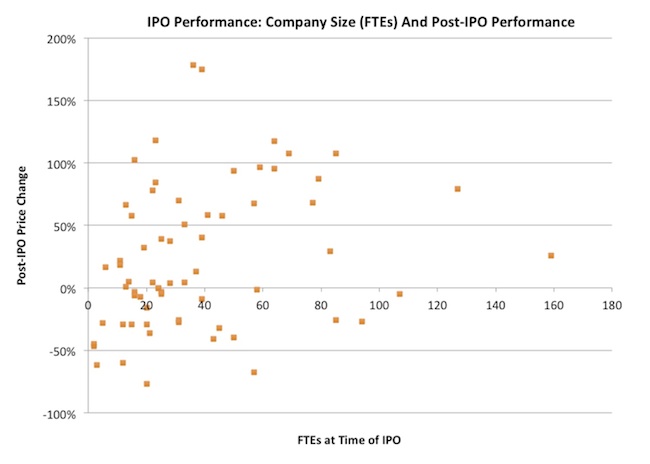
- Companies of all shapes and sizes are doing well. Comparing the number of employees at the time of an IPO (in the S-1) to the post-market performance, there appears to be no correlation at all. Bigger teams and more infrastructure don’t by default drive better returns, and vice versa, as the scatter plot below suggests. Some of the biggest out-performers had less than 25 FTEs. That said, micro-companies don’t appear to be trading well in the after-market: all six biotech offerings with less than 10 FTEs have traded down.

As these observations suggest, there are some interesting distributions and virtuous/vicious cycles at work in the markets today.
It’s anyone’s guess what happens to the IPO market for the second half of 2014. Like many others in January, I thought the window would cool as the crop of 2013 and 1Q 2014 IPOs were digested by public equity investors (here). Instead we’ve seen the busiest six months in the history of biotech. There are lots of fundamental reasons to think the window will remain open – clinical data catalysts, large and mid-cap biotech successes, continued M&A pressures, historically low Fed rates continue to support allocations into higher risk equities, etc… But hiccups are just as likely – the storm around Solvadi’s pricing amazingly cast a pall over the whole sector for a couple months.
Irrespective of how the second half plays out from a stock price perspective, the great news in all this is that a whole new generation of small cap public biotech stocks have been energized by billions of dollars of growth capital. Will be interesting to see what they are able to do with it.