The biotech IPO market in 2020 remains strong, despite the volatility and COVID headwinds. We’ve seen stellar pricings and good after-market performance, with ten new offerings already this year. And the queue for companies with active S1’s on file is growing; another dozen or so are likely to go out by mid year.
The resilience of the IPO market in the midst of the recent market dynamics is surprising to many, including me, but likely reflects both how IPO ‘books’ are built today (with strong insider support) and the relative outperformance of biotech during economic recessionary periods. It’s also a reflection of just how deep the equity capital markets have become in biotech, with strong specialist and generalist coverage of the space. Despite COVID, and the biotech markets being off 10-15% year-to-date, the indices (XBI, IBB) are roughly in the same range as where they were in October of last year, so not a hugely distorted market given the volatility.
As a quick example of this longitudinal IPO resilience, we’ve seen new issuances from biotech firms in all but nine of the past 88 months since the IPO “window” super-cycle began in early 2013, with companies getting out even in the market downdrafts of March 2020, December 2018, February 2016, and August 2015. Even prior to 2013, there was a steady trickle of IPOs – such that we’ve seen IPOs every quarter since mid-2009: 40 straight quarters with new issuance activity. This is the longest running quarterly IPO window in history, and a far cry from the feast and famine nature of the markets for the first few decades of biotech.
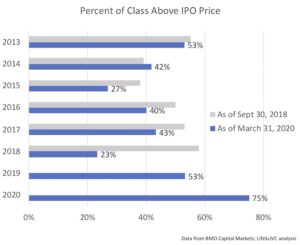
This year’s IPO class is also off to a staggeringly strong start by historic standards: the highest average pre-money valuations (over $500M)ever seen in a quarter, with the vast majority trading over their IPO issue prices. As a banker would say, despite COVID, this market is actually “very constructive” for getting IPOs priced today.
We should expect more dispersion in post-market performance for the class of 2020 over time, as having 75% stay above their IPO price would be a historic anomaly, as illustrated in the chat on the right.
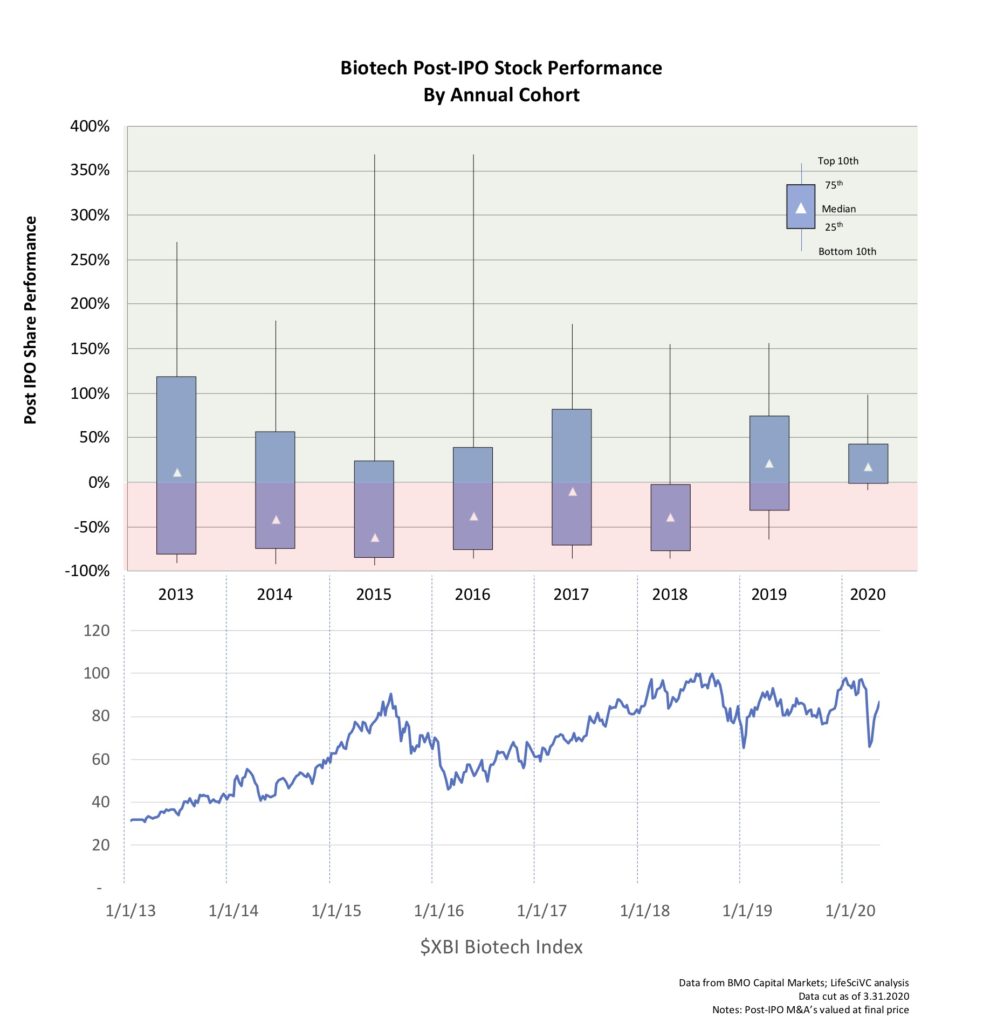
As I’ve discussed in the past, like in this Oct 2018’s blog on the IPO bonanza that year, the dispersion in share price performance at the top and bottom gets wider with longer time in the markets. Here’s a chart of where past IPO cohorts are today relative to their offer price, thanks to a longitudinal dataset from BMO Capital Markets.
Of note, the IPO classes that predominantly priced during cyclic peaks in the overall biotech markets, as traced above by the $XBI S&P Biotech Index, have generally performed worse over time – with lower median post-IPO performance. These include both 2015 and 2018 classes, when the index reached all-time highs.
So the bigger question for long-term investors (and observers) is how does this dispersion of IPO performance over time impact value creation?
As others (like Geoffrey Porges at Leerink) have described before, the dispersion in performance follows Pareto’s Law, where relatively few companies drive most of the outperformance. Given the length of the IPO super-cycle, and its remarkable resilience, it’s worth revisiting the specifics around dispersion and its impact on value.
To track value creation post-IPO, you have to disaggregate the impact of an expanding share count from the underlying appreciation of the value. Here’s one simple methodology for doing that: if you take the stock price change since IPO, and multiply it by the IPO post-money valuation, you get a sense for the real value creation since IPO for the original post-offering shareholders. This eliminates the distortion of just looking at market capitalization changes, which are impacted by share count increases due to evergreen grants to employees (typically ~4% annual dilution) and, more significantly, from serial follow-on financings. For example, the value creation for the IPO shareholders in Bluebird and Blueprint has been very attractive, at $780M and $1.2B, respectively; but their market capitalizations have gone up by $2.1B and $2.6B, reflecting the billions in aggregate follow-on offerings. In contrast, Epizyme’s market capitalization has gone up by over $1B, but its actual post-IPO value creation is minimal (as its March 31st closing price was essentially the same as its 2013 offering price). This is why it’s important to parse the data when looking at value created.
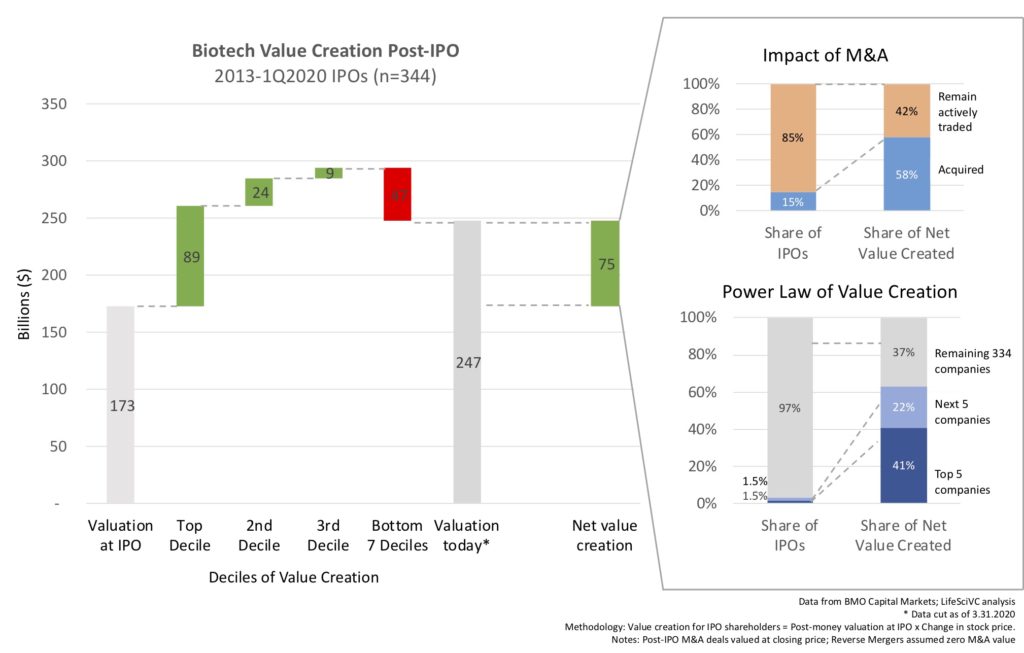
Here’s the summary, after examining the dispersion in performance of the 344 biotech IPOs since 2013 through the end of the first quarter of 2020:
- These biotech IPOs have created ~$75B in net value from their initial IPO shareholdings
- The top 3 deciles created nearly $122B in gross value, but the bottom 7 deciles destroyed $47B since their IPOs.
- The top 10 companies out of 344 IPOs grossed about two-thirds of the total net value creation.So 3% of the offerings drove 63% of the net value created.
- Companies that went public but were subsequently acquired drove 58% of the overall value created, and yet only represented 15% of the underlying number of companies.
As one would expect, value creation in biotech is a big power law, with huge returns being driven by relatively few players. The striking delta between the huge value creation at top, and massive value destruction in bottom 70%, is remarkable.
A few conclusions and further observations can be drawn.
First, not surprisingly, the big winners are the companies that brought drugs into later stages of development, if not the market, and were “leaders” in their fields: Kite and Juno in the CART space, AveXis and Spark in the gene therapy world, novel antibodies like Ablynx and Argenx, mRNA therapies like BioNTech and Moderna, cancer players like Loxo and Beigene, etc…
Second, the impact of dilution and raising follow-on financings is very large. The corporate value increases looking only at market capitalization, which includes share increases from FOPOs and incentive compensation, is roughly double: $152B in market capitalization increases since IPO. It’s hard to know how much value was created for these FOPO investors as it obviously depends on their price entry points.
Third, a well-timed M&A exit can lock in an enormous amount of value when the road to drug launches is long, costly, and fraught with volatility. Nine of the top 15 value creators since IPO were acquired. Given the challenge of developing new medicines, finding great partners through M&A can be hugely helpful beyond the immediate value realization. For example, consider the post-acquisition speed bumps that Kite and Juno have had in developing and launching CART products, or Receptos’ ozanimod FDA hurdles, or AveXis’s data integrity issues. Because they were in the hands of well-capitalized, capable partners, those products are all now delivering value for patients while growing revenues (or are on their way to). Through the acquisitions, value was crystallized for the shareholders, while greatly reducing their exposure to the volatility and dilution that would have been required to get through those speed bumps – while ensuring their drugs would have a well-resourced global sponsor to bring them to market. In short, the outsized role of M&A in capturing significant value during this IPO super-cycle is very clear in these data.
Lastly, IPOs as a whole have created an enormous amount of value for biotech shareholders, upwards of $75B in net value creation, despite the fact that the majority of IPOs will fail to deliver shareholder value beyond their post-money valuation. While value got destroyed by the bottom 7 deciles, the top 3 deciles delivered considerably. One takeaway from this is that taking a portfolio approach is important: it’s incredibly difficult to just pick a single IPO and hope it’s the “one”, just like picking a single drug program as launch-ready when its early in development . With strong science and great teams at many companies, there are very few “biomarkers” at IPO that predict outperformance: for example, valuation (and thus amount of capital raised) at IPO has no correlation with post-IPO performance. Having a portfolio of smartly-placed oil wells (or IPOs) is helpful in ensuring enough sampling to hit the bounty in the top decile. A second takeaway is that in light of biotech’s event-driven volatility (as reflected in these dispersion data), it’s very common for post-IPO companies to move in and out of the “positive value creation” deciles over time. A 2018 analysis by Jefferies suggested that only 14% of the 2013-2018 IPOs had never “broken issue” by falling below their IPO price: in other words, 6 out of 7 biotech IPOs will trade into the “value destruction” range at some point after their IPO. Importantly, though, upward mobility into the top performing value-creating deciles is possible. As an extreme example, Moderna traded off nearly 45%, or over $3B in “value destruction”, the the nine months after it’s IPO debut, before catapulting to huge value creation today (obviously helped by the COVID mRNA vaccine excitement).
With dreams of delivering an impactful medicine and creating real value, and the need to access significant capital to fund those dreams, I’m confident we’ll continue to see a steady flow of IPOs in 2020 and beyond. It will be interesting to watch the value they create over time for patients and shareholders, as well as the anticipated wide dispersion in outcomes.


