


Venture capital has been on a good run over the past few years across a range of sectors; even with recent slowdown relative to 2014-2015, venture-backed investments remain above historic averages. In fact, the first three quarters of 2016 alone are already higher than the annual rate of venture investing in all but two years since 2002.
Like the overall venture capital asset class, biotech has also been strong over past few years: 2014-2016 will be the three largest years for private biotech funding since the start of data collection in 1995. On the public market front, even with the 30%+ correction since July 2015, we’ve continued to see significant IPO activity and will likely have over 30 biotech IPOs this year – a top quartile year for new issuances.
It’s worth noting that biotech has witnessed a much more receptive IPO market over the past three years than other venture sectors: during that period, biotech has represented only 11% of VC financings, but 54% of VC-backed IPOs. And the demand from larger companies for biotech is at historic levels: private M&A values over the past few years are 3x what they were in 2010-2012, as described back in September (here).
Against this backdrop, it’s not surprising that there’s been a solid market for raising new venture funds focused on biotech investing: just in the past few weeks, we’ve heard of new funds from Sofinnova, Third Rock, and Versant, and a number of others are in the market. Interest from institutional Limited Partners (those who invest in VC funds) into the field is certainly higher than it was five years ago when pundits were lamenting the demise of life science venture.
One would think in light of the solid performance in biotech that we’d either be growing within the venture sector, or at least holding our own as a share of the industry. As I wrote in August, that’s surprisingly not the case: biotech has been shrinking as a share of the asset class over the past few years, moving from 19% of investments in 2010 down to 12-13% in 2015-2016. That’s over a one-third reduction in “market share” for biotech despite its stellar performance.
Why is this?
The biggest driver is the significant inflows of funding into the technology sectors within venture capital (like software), which are up 300-400% in the past few years (vs biotech up 50%). Technology has seen the emergence of a number of mega-VC funds, as well as a near Cambrian explosion of micro-VC funds – leading to a big infusion of LP capital. This dramatically changes the denominator, and hence the relative market share for biotech.
But another reason is the continued existence and propagation of negative myths engrained in the conventional wisdom about biotech venture capital, especially across many in the LP community, including family offices, endowments, pensions, and fund of funds. We’ve heard some FoF managers say they only invest in tech VC because “that’s where venture returns are.” On occasion (thankfully less often than 5-years ago), we still hear common refrains like “… but it takes 12-15 years to bring a new drug to market” or “… biotech’s losses are too big and too binary…” or “… biotech is too risky.”
Fortunately, a number of LP’s have either done their homework with industry data, or have direct exposure to one or more of the high performing biotech venture funds. But a large swath of the LP community, and more generally the layperson audience, is still anchored to myths from earlier eras of venture capital.
Back in 2013, I wrote a piece “debunking” many of these myths, and in 2015 again highlighted the positive comparative performance of biopharma. These myths have been wrong for years, but they are even more wrong today.
In an attempt to synthesize prior points, and to look at updated data sets, let’s tackle the three major myths – that biotech returns lag other VC sectors, it takes too long, and the losses are more frequent and much bigger.
Returns.
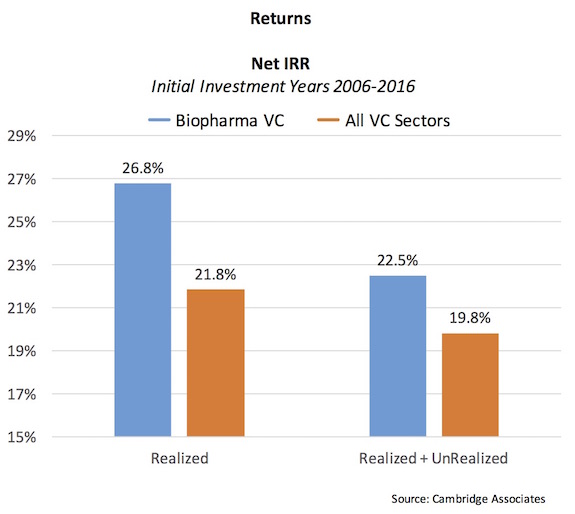
Biopharma returns have indeed been quite strong over the past decade. Leveraging data from global investment firm Cambridge Associates, biopharma venture capital’s net IRR (e.g., the Internal Rate of Return net of fees) for initial investments made during the decade of 2006-2016 outperformed the venture capital asset class as a whole by over 500 basis points for realized (exited) investments. Including illiquid, unrealized investments (those still in progress), the combined net IRR for biopharma deals in this period still outperforms by over 250 basis points. While some subsectors (like software) perform more in line with biopharma during the period, other technology sectors don’t – creating the aggregate differential.
Another way to look at the returns is via their distributions. The chart below plots the cumulative distribution of deals on the y-axis, and the multiple of invested capital on the x-axis. The top decile and top quartile returns are the 90th and 75th percentile lines on the y-axis. The rate of high-performing 5x or greater deals is 50% greater for biopharma than IT/software (15% vs 10%, respectively), and the top quartile multiples differ by a full turn of invested capital (3.5x for biotech vs 2.5x for IT/software, respectively).
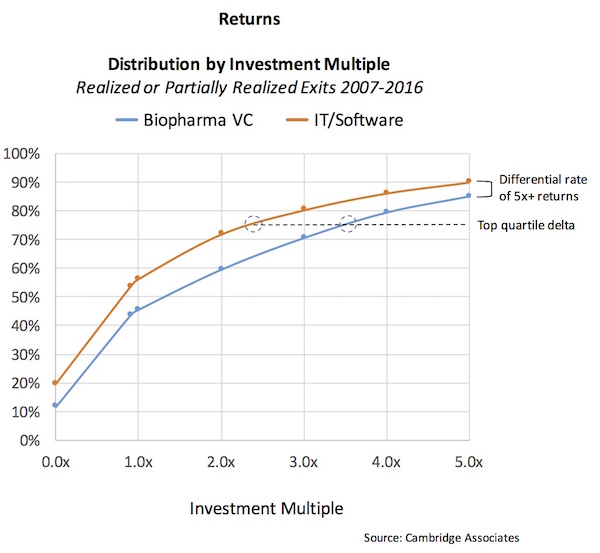
This distribution bodes well for the sector as a whole, and for investment managers within it – as this curve implies that biopharma has more predictability and is less dependent on rare outlier effects versus a tech sector that is more biased towards the one-in-a-hundred lottery ticket. The Cambridge dataset explored here doesn’t track above 5x, but I’ve blogged on the differences at the higher end of the distribution before (here), and those are consistent with this theme.
Holding Periods.
Biotech investors typically don’t start drug discovery companies with the expectation of bringing those medicines to market during a single fund’s investment period: we all appreciate that drug R&D is a long cycle endeavor.
But different players participate in different stages of the process. In general, early stage VCs participate in discovering potential medicines and advancing them to early clinical proof of concept, at which point alternative capital providers like the public markets (via IPOs) or larger Pharma (via M&A) take on the later stages of development and marketing. This allows for shorter investment cycle times (vs full drug R&D timelines) for early stage biotech investors.
On the other hand, many technology companies need to become “real businesses” before they are able to generate an exit – often taking years to build the repeatable sales growth model and profitability.
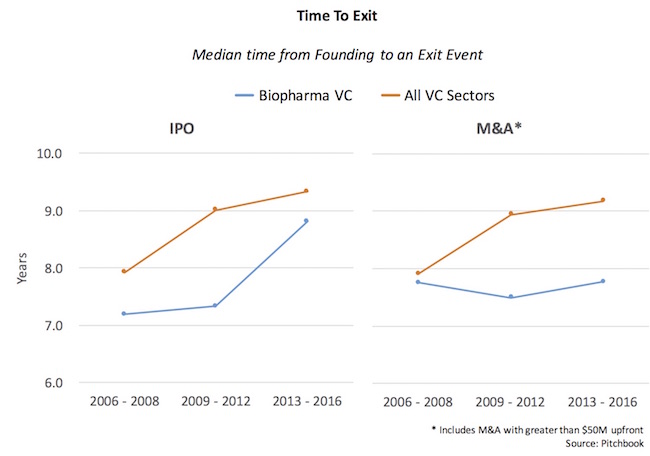
Data tracking the time it takes from company founding to an exit event reflect this dichotomy. The two charts below capture these data, as tracked by business analytics firm Pitchbook. For both the median time to IPO or to major M&A event ($50M or greater), biopharma has been faster than the rest of venture capital as a whole over the last decade, in line with prior analyses (here, here).
Biotech investment strategies that engage pharma partners early by focusing on cutting-edge innovation can bias even faster than these median data. For our last 12 biotech exits at Atlas, our median holding period has been 5.0 years – much faster than typical holding periods.
Loss Ratios.
Losses in venture happen, and they happen reasonably frequently. We’re in a high-risk asset class, so this should be expected. But a common criticism of biotech is that there are either more losses and/or larger ones – neither of which is supported by the data.
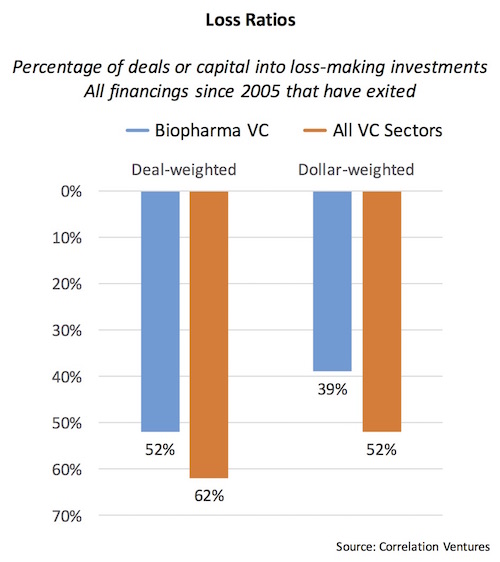
The primary way to analyze this is through loss ratios. These metrics are either deal-weighted or dollar-weighted: the former captures what percentage of deals lose money (go below 1x), and the latter captures what percentage of the dollars invested go into loss-making deals.
Based on a recent analysis from the data-driven investment firm Correlation Ventures, biopharma has lower deal- and dollar-weighted loss ratios than the rest of venture capital. Roughly 15% fewer deals lose money in biopharma, and 20% fewer dollars are exposed to those loss-making deals. These data are similar to those from Adams Street (here).
Our seed-led strategy at Atlas is aimed at reducing the dollar-weighted loss ratios even further: by taking most of our losses in the seed-stage, where we attempt to derisk the early science and story, our dollar-weighted loss ratio in Funds VIII and IX is around 25%.
Conclusion
Biopharma has been and will likely continue to be a strong sector within venture capital, as many of its tailwinds reflect secular and structural forces: significant unmet medical needs remain addressable by pharmaceuticals, aging populations in both the developed and emerging markets will further drive demand, Pharma R&D relies upon external sourcing to complement its internal efforts (even more so with pricing constraints), biomedical science is becoming more translational in focus, etc… All of this bodes well for early stage biopharma.
However, and coming full circle, we’ve recently seen the “odd juxtaposition” of strong performance and shrinking market share in venture. I’ve attempted to address the question of why, and hopefully debunked some of the myths above.
But it’s worth asking – does market share in venture even matter?
Frankly, it almost certainly doesn’t in the grand scheme: enough institutional LP’s appreciate the performance potential of biotech and are making capital commitments into new funds; the sector is functioning well with a measured pace of startup creation and investing activity; new medicines are advancing through R&D; and, as a sector, we’ve been delivering with compelling returns.
Beyond all that, we’re also delivering on the biotech’s important double-bottom-line mission of doing well by doing good.